This is the second part of my latest 3-part article series on COVID. I highly recommend you read the first part before moving on: Ending The “Corona-Panic”: 5 Facts Proving We’re Going To Be Just Fine (Part 1)
Table of Contents
(Missed part 1? Read it here)
Fact #3: Children And Healthy Adults Under 65 Years Old Face A Minuscule Risk Of Dying From COVID
3.1 The #1 Risk Group: 65+ With Pre-Existing Conditions
3.2 Sad But Important Caveat: Chronic Diseases Are The Real Pandemic Here
3.3 All That Being Said, Your Children Are Way More Likely To Die From The Flu Than COVID
3.4 There’s A Chance COVID Might Not Be Transmittable By Children
3.5 Closing Schools Is Probably Extremely Counterproductive
Rational Recommendations About COVID, Children & At-Risk Groups
4.1 COVID’s Lethality Will Likely Be Close To The Seasonal Flu
4.2 A Large Fraction Of “Confirmed” COVID Deaths Are Probably Due To Something Else
4.3 A Large Fraction Of “Excess” Deaths Might Have Been Caused By The Panic, Not COVID
Rational Recommendations On Reporting COVID Deaths
Part 3: Read It Here
Fact #3: Children And Healthy Adults Under 65 Years Old Face A Minuscule Risk Of Dying From COVID
The Coronavirus pandemic [is] a pandemic of panic, more than anything else. […] We don’t even know if the risk of dying if you get infected with Coronavirus is higher than if you get influenza, or so many other virus infections, and most of those who die are old and suffer from comorbidity, just like for influenza. [emphasis mine]
– Prof. Peter C. Gøtzsche, researcher and founder of the renowned Cochrane Medical Collaboration
The story was sad and well told, but I was mad as hell when I heard the reporter’s conclusion.
I’m referring to the death of a 44-year-old doctor in Quebec on April 16th. He was the first doctor to die in the province of “complications from COVID-19”.
The story is tragic, I’ll give you that, and I myself easily tear up when I listen to human tragedy. But when the reporter added that “this death is yet another proof that COVID can kill anyone, at any age”, I was mad. Way to go, you professional fearmonger.
This is certainly not the last time I’ve heard people — who clearly suffered from a serious case of the “Corona-Panic” — report on exceptions and conclude that they are the norm. One 5-year-old kid allegedly dies from COVID? All children are at risk. A 32-year-old dies from a heart attack after having tested positive for COVID? COVID causes heart attacks and might kill everyone who’s in their thirties.
Just lately, US Ohio Governor Mike DeWine contributed to the overall hysteria and tweeted:
People of all ages are getting sick and dying from #COVID19. [emphasis mine] We are learning that people are having strokes and other things that we didn’t understand in the beginning.
Again, exceptions are not the norm, and public policy (and our reaction to this new virus) should be based on hard data and facts, not tragic anecdotes reported in the media.
And what does that data actually say about who is really at risk of dying from a COVID infection? Let’s take a look…
3.1 The #1 Risk Group: 65+ With Pre-Existing Conditions
5 months into the COVID crisis, we have a lot of data about who’s at risk of dying from COVID, and who’s not.
People who face an important risk of dying from COVID are adults who are 65-years-old and with at least one pre-existing condition. John Ioannidis, a Stanford researcher and one of the most respected US-based scientists in the world, has identified with his colleagues that “people under 65 without underlying conditions accounted for only 0.7% of coronavirus deaths in Italy and 1.8% in New York City.”
Simply put: The older you are, the more risk you face. Italian researchers from the Istituto Superiore di Sanità (leading technical-scientific body of the Italian National Health Service) found out that one of the reasons COVID has been way more deadly in Italy than in China is simply that Italians are way older on average.
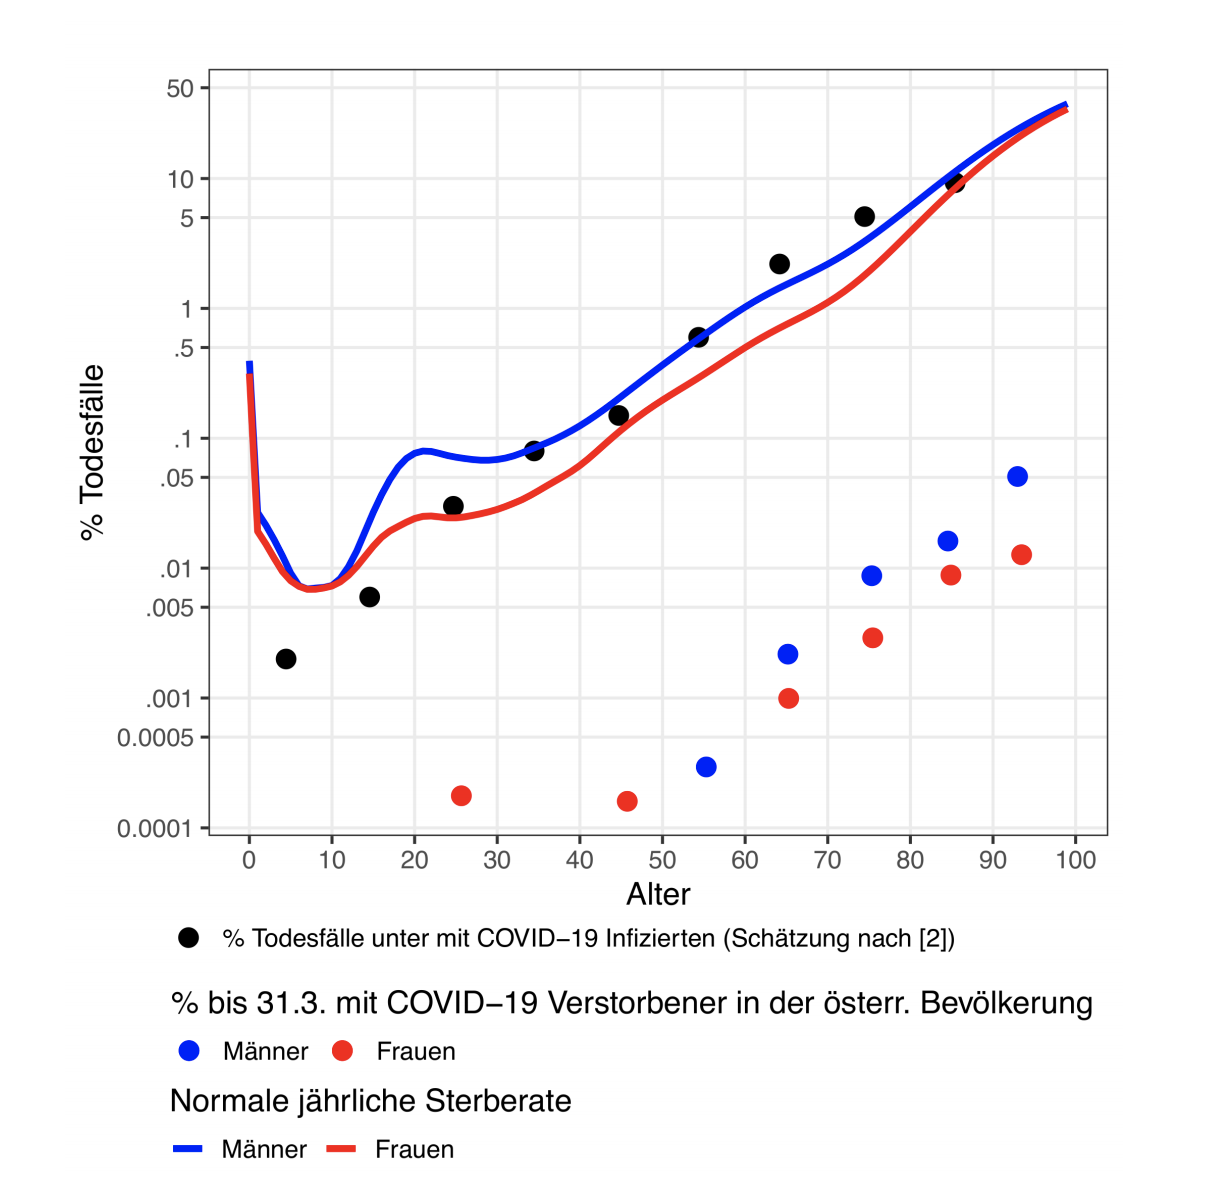
The researchers concluded that: “in line with international studies, the Austrian data also suggest that the risk of death increases sharply with age. The observed age dependency is consistent with that of the general annual risk of death in Austria.”
Source: Poch et al. “Erste Analysen ¨osterreichischer Covid-19 Sterbezahlen nach Alter und Geschlecht” [First analyzes of Austrian Covid-19 deaths by age and gender]. Updated April 21st 2020.
In 2019, nearly 25% of the Italian population was 65 years or older, compared to only 11% in China. The overall case fatality rate in Italy as of mid-March was 7.2% – much higher than China’s rate of 2.3% at a comparable stage of its epidemic. But from the ages of zero to 69, the two country’s case fatality rates are comparable. (full study here)
If you’re over 60, 70 or even 80 but are fairly healthy, you still face some degree of risk, but a mere fraction as much as those who have one or multiple “pre-existing conditions”. These include:
- Being overweight/obese (66-75% of all COVID-related ICU admissions in the UK)
- High blood pressure
- History of heart problems including previous heart attacks, or previously damaged coronary arteries (66%+ of a few autopsies done in Switzerland)
- Diabetes
- Being immunocompromised (according to the CDC)
- Chronic lung disease or asthma
- Chronic kidney disease
- Liver disease
Across the board, the vast majority of all people who died of COVID had one or multiple conditions. A few examples include:
- United Kingdom: 91% had at least one condition. “On average, people dying also had roughly three other health conditions.”
- New York City: as of May 21st 99.2% of confirmed deaths had at least one condition [If we ignore the cases where pre-existing conditions were “unknown”. If we consider that the “unknowns” did not have conditions, that number is still 79.1%]
- Italy: as of May 14th, 96% of all COVID deaths had at least one condition. Around 60% had at least 3 conditions.
Unsurprisingly and tragically, 40-70% of all COVID deaths (82% in Quebec) worldwide have been been in nursing homes — a segment of the population that is older (85+ on average in Canada), and that often has multiple pre-existing conditions.
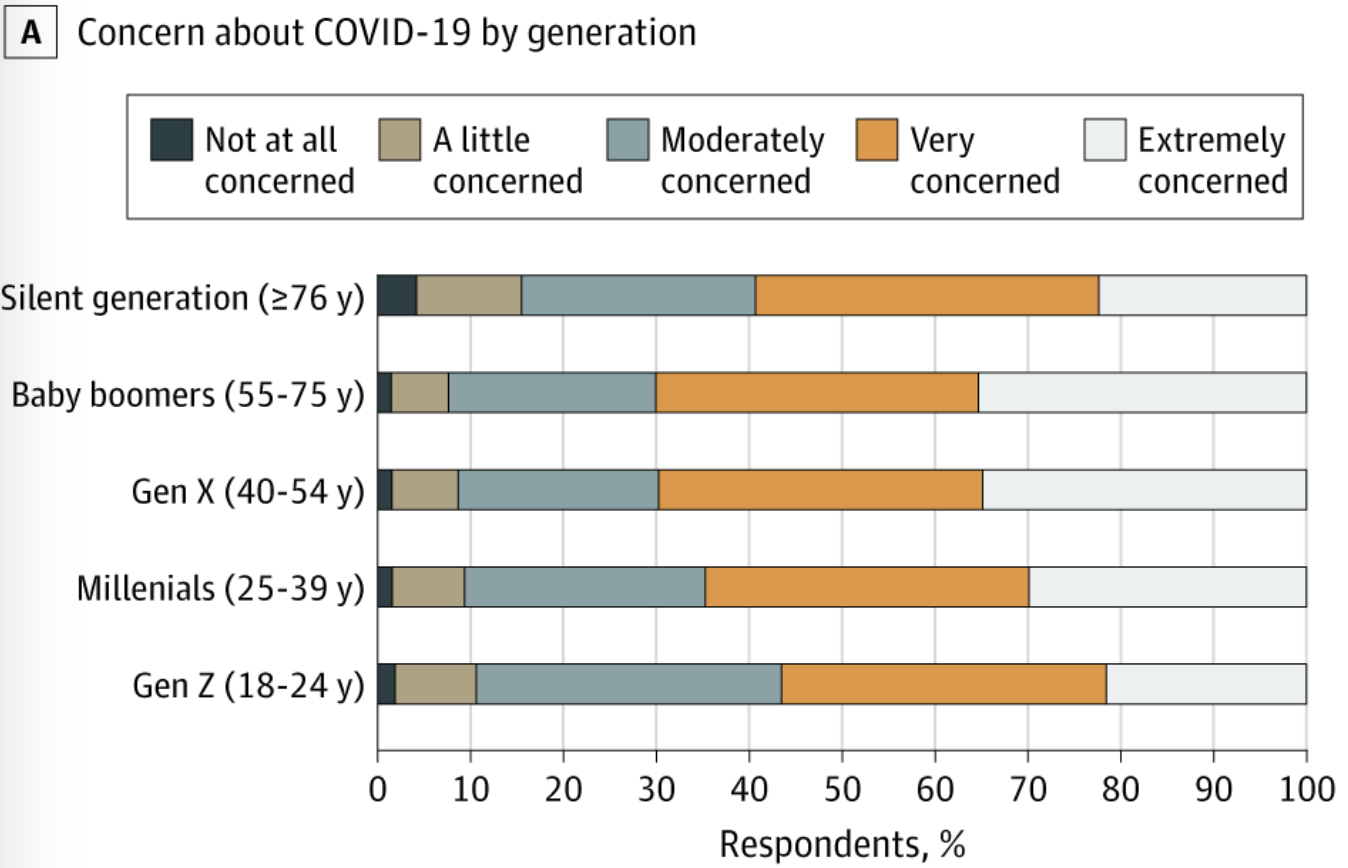
Fun fact: fear of COVID is generational, and those that are the most at risk — people 76 years old and older — are actually the least concerned of dying from it.
Image source: Nelson et al. US Public Concerns About the COVID-19 Pandemic From Results of a Survey Given via Social Media. JAMA Intern Med. Published online April 7, 2020. doi:10.1001/jamainternmed.2020.1369. Adapted from https://cdn.jamanetwork.com/ama/content_public/journal/intemed/0/ild200019f1.png. I cut the image in half and kept only the left side of the graphic. / CC BY-SA 4.0
There also are a few other factors that might increase your risks of dying from COVID:
- Deficiency of G6PD enzyme: A genetic predisposition that is more prevalent in “persons of African, Asian, and Mediterranean descent“. This might explain why so many African Americans are dying from COVID.
- Sex: Men are twice more likely to die from COVID than women (source)
- Vitamin D deficiency: In one study from Indonesia, mortality from COVID was 49.1% in people with Vitamin D deficiency, but only 4.2% in those with sufficient levels.
3.2 Sad But Important Caveat: Chronic Diseases Are The Real Pandemic Here
If you are under 65 and don’t have underlying conditions, then you virtually face no risk of dying from COVID. (In case I didn’t previously make myself clear: Yes, I know there are exceptions — and these have been highlighted way enough already in the media. You can find exceptions for every single disease out there if you look hard enough.)
But the reality — and I cannot possibly ignore this while writing an article which offers a balanced view of the situation — is that the number of people who suffer from these pre-existing conditions all around the world is increasing at a staggering rate.
In 2017, 60% of all Americans lived with one chronic condition, and 42% with more than one. The devastating reality is that this is also true in children: 43% of them in the US (2011 numbers) have one chronic disease, a number which increases to 54.1% when factors such as ‘being overweight’, ‘obese’, or ‘being at risk for developmental delays’ are included.
The WHO reports that this trend is seen everywhere, both in poor and rich countries:
The burden of chronic diseases is rapidly increasing worldwide. It has been calculated that, in 2001, chronic diseases contributed approximately 60% of the 56.5 million total reported deaths in the world and approximately 46% of the global burden of disease. […]
The chronic disease problem is far from being limited to the developed regions of the world. Contrary to widely held beliefs, developing countries are increasingly suffering from high levels of public health problems related to chronic diseases.
In five out of the six regions of WHO, deaths caused by chronic diseases dominate the mortality statistics. […] It has been projected that, by 2020, chronic diseases will account for almost three-quarters of all deaths worldwide. [emphasis mine]
It’s safe to say that as time goes by, the proportion of the population who’s at risk of dying from COVID — but also from pretty much anything life throws at them — is rapidly increasing. More than ever, it’s important to elucidate why these chronic diseases are on the rise (and stop ignoring environmental factors such as electrosmog/EMFs, environmental toxins, etc.), and focus on prevention.
3.3 All That Being Said, Your Children Are Way More Likely To Die From The Flu Than COVID
Even though about half of all US children already live with a chronic disease, COVID has virtually killed none of them so far — a trend that is true around the world.
If you’re a parent, this means you can let go that sigh of relief and stop “corona-panicking” for your children. Do it, right now.
Let me repeat it, considering that at least 40% of parents in the UK are still afraid of sending their children back to school. The seasonal flu is way more dangerous for your children than COVID.
No parent freaks out about their children catching the flu, so no one should freak out about them catching COVID. It’s that simple.
But as always, don’t trust me… trust the data:
COVID
The CDC admits that “for children (0-17 years), COVID-19 hospitalization rates are much lower than influenza hospitalization rates during recent influenza seasons.”
How much lower? At the time of writing, the CDC provisional death toll for flu-like illnesses showed that only 9 children under 14 years old died from COVID, and only 51 under 24 years of age. That’s out of a population of around 330 million people.
This is no exception. As reported by journalist Alex Berenson: Out of the first 12,000 (allegedly) confirmed COVID deaths in the UK, a total of zero were people under 15 years old. Only 28 deaths under 30, and 286 under 50 years old — that’s in a country with more than 66 million citizens.
The Australian government came to the same conclusions, and recently informed its citizens that “COVID-19 is not the flu. Far fewer children are affected by COVID-19, and the number of transmissions from children to children and children to adults is far less.”
Seasonal Flu
The seasonal flu regularly (and very tragically) kills a few hundred children every single year in the US. The CDC reports that so far during the 2019-2020 flu season, 81 children from 0-14 years old and 122 under 24 years of age died from the flu.
Things have been worse in past flu seasons. In 2018-2019, 477 children 17 years and younger died from the flu. In 2017-2018, that figure was 643.
The bottom line: Both viruses are not recognized as a huge danger for children, but if we really want to push the comparison, the seasonal flu is way more dangerous for your children than COVID. As reported in JAMA:
Thus, up to this time of the pandemic in North America, children continue to face a far greater risk of critical illness from influenza than from COVID-19, [emphasis mine] pointing to the imperative for ongoing preventive pediatric health maintenance during this time.
Lockdown Sceptics also pointed out that based on the latest data, “the chances of a child under the age of 15 being struck by lightning are four times higher than them dying of COVID-19.”
3.4 There’s A Strong Chance COVID Might Not Be Transmittable By Children
“Children under the age of 10 in Switzerland have been told they can now hug their grandparents as the country begins to ease coronavirus lockdown measures.” I was so happy when I read this quote in a SkyNews article on April 29th. (Quebec followed course shortly after.)
Dr. Daniel Koch, who leads Switzerland’s response to COVID, said that scientists “now know young children don’t transmit the virus.” He’s talking about children under 10 years old, to be clear.
Not all scientists agree with Koch’s conclusions, which he came to after consulting his colleagues from Universities in Zurich, Bern and Geneva. Some think it’s too early to tell if children can easily transmit COVID to people at risk.
Koch’s recommendations do corroborate the findings made by several studies in which children infected with COVID were in contact with many people and virtually infected no one. A few examples include:
- In the French Alps, a 9-year-old child was in contact with 172 people, and transmitted COVID to only one of them (source)
- In the Italian town of Vo, which was under a complete lockdown very early and where almost all residents were tested, not one child under 10 (out of 234) tested positive for the virus (source)
- Dr. Ebere Okereke, a consultant in global public health for Public Health England, has recently claimed — based on a recent review of the evidence done by the Royal College of Paediatrics (RCP) — that “children do not appear to transmit coronavirus”. “So no risk of children passing it on to their teachers – or their parents or their grandparents” (source)
- In Iceland, a study has found that “children under 10 years of age and females had a lower incidence of SARS-CoV-2 infection than adolescents or adults and males.” Out of a random screening of thousands of citizens, no child under 10 had COVID. (source)
- The China/WHO joint commission report (published in late February) has not found a single instance of transmission from a child to an adult (source)
- In previous outbreaks of SARS (2003), the “evidence suggested that transmission in schools was very low or absent” (source)
- The government of Quebec agrees with the Swiss and have allowed grandparents to take care of young children since early May (source)
- The WHO finally admitted on May 17th that “children seem less capable of spreading virus” and that they face a “very low risk of getting ill.” (source)
3.5 Closing Schools Is Probably Counterproductive
Considering that children face virtually no risk of dying from COVID, if we decide to keep schools closed, it would only be to protect teachers, or families of these kids who might eventually get infected. These are fair arguments.
But as I’ll explore in Fact #5, the goal of that whole “flatten the curve” idea was not to never have anyone catch COVID… it was to ensure our hospitals are not overwhelmed. So far, this has simply not been the case anywhere around the world except in a few rare instances (like some hospitals in New York City).
Back to my main point: Closing schools. Several countries like Sweden did not close their schools (on top of keeping bars and restaurants open), and fared very well overall (more in Fact #5).
When he was asked by Nature (one of the most important scientific journals in the world) why Sweden did not shut down schools, leading epidemiologist Anders Tegnell answered:
About schools, I am confident they are going to stay open on the national level. We are in the middle of the epidemic and, in my view, the science shows that closing schools at this stage does not make sense.
You have to shut down schools fairly early in the epidemic to get an effect. [emphasis mine] In Stockholm, which has the majority of Sweden’s cases, we are now close to the top of the curve, so closing schools is meaningless at this stage. Moreover, it is instrumental for psychiatric and physical health that the younger generation stays active.
In The Lancet, researchers have confirmed that while “188 countries have implemented country-wide school closures, [a] modelling study by Ferguson and colleagues concluded that in the UK, school closures alone will reduce COVID-19 deaths by only 2–4%. [emphasis mine]” If you trust The Imperial College London, that is. (you’ll understand that joke in Fact #5)
After reviewing all this evidence, and considering that (at least in Quebec) health officials have realized that kids with learning disabilities can regress if they don’t have the necessary support, many countries have taken the decision to reopen schools:
- Denmark — started April 15th
- Norway — started April 27th
- Israel — started May 3rd
- Iceland — started May 4th
- Netherlands — starting May 11th
- Quebec, Canada — starting May 11th
- Switzerland — starting May 11th
- You can read a more exhaustive list here from the BBC
Rational Recommendations About COVID, Children & At-Risk GroupsFor concerned citizens:
For decision makers and the media:
|
Fact #4: COVID Is Definitely Not The Spanish Flu, And A Large Fraction Of COVID Deaths Are Probably Due To Something Else
There’s some sort of mob mentality here operating that they just insist that this has to be the end of the world, and it has to be that the sky is falling. [emphasis mine] It’s attacking studies with data based on speculation and science fiction. […] But dismissing real data in favor of mathematical speculation is mind-boggling.
– John Ioannidis, professor of medicine, of epidemiology and population health, of biomedical data science, and of statistics at Stanford University and co-director of Stanford’s Meta-Research Innovation Center. Among the top 100 most cited research scientists worldwide.
One of the reasons the world was struck with a wave of fear a few months ago is that the death rate of COVID — based on early data coming out of China — looked arguably dire at first. But it’s the way these figures have been communicated to the public and media that turned this fear into a full blown out case of “Corona-Panic”. Let’s see what happened.
In late February, the WHO/China joint committee published a report where it was discussed that the CFR (Case Fatality Rate — the number of cases divided by the number of deaths) “was higher in the early stages of the outbreak (17.3% for cases with symptom onset from 1-10 January) and has reduced over time to 0.7% for patients with symptom onset after 1 February.”
Then, on March 3rd, Tedros Adhanom — Director general of the World Health Organization — made a statement that made a lot of people panic.
“Globally” he said, “about 3.4 percent of reported COVID-19 cases have died. By comparison, seasonal flu generally kills far fewer than one per cent of those infected.” [emphasis mine]
Adhanom irresponsibly compared apples to oranges, as I’ve previously explained in my last article. My understanding is currently way better than it was several weeks ago, so my argument will be more scientifically precise this time around.
COVID-19 did show a Case Fatality Rate (CFR) of 3.4% when the announcement was made. That’s 3,110 deaths out of 90,893 “confirmed” cases (keeping in mind that a lot of these confirmed cases and confirmed deaths are probably not related to COVID-19 at all… but let’s take these numbers at face value for a bit). But it’s widely recognized that early CFRs in pandemic are always way, way higher since tests are done in people who are symptomatic.
It’s not the first time that early estimated case fatality rates have been inflated and caused panic. As reported by the BBC:
One example is the H1N1 pandemic of 2009, known as swine flu. Early case fatality rate estimates were inflated by a factor of more than 10. Even 10 weeks into the epidemic, estimates varied widely between countries, coming in between 0.1% and 5.1%. When medics later had a chance to go through case documents and evaluate cases, the actual H1N1 case death rate was far lower, at 0.02%.
Back to Adhanom. WHO’s devastating fault was to compare this early CFR — which ignores all COVID cases which are asymptomatic (50-70% of them globally), and all cases that are undetected — to flu’s 0.1% estimated IFR (they use a ‘symptomatic’ infection fatality rate). Apples, to oranges.
Flu deaths, at least in the US, are calculated by dividing the number of estimated deaths (a number extrapolated from flu hospitalizations and adjusted for people who might have died at home) by the number of estimated cases of symptomatic flu illness this season.
During this 2019-2020 flu season which started on October 1st and is pretty much done now, the provisional numbers are 24,000 to 62,000 flu deaths, and 39 to 56M flu illnesses. This corresponds to an IFR of 0.04 to 0.16%. This number will become more precise over time.
How does COVID compare?
4.1 COVID’s Lethality Will Likely Be Close To The Seasonal Flu
On April 21st, the WHO came back with another solid dose of fear mongering. Double strike. As the world was starting to realize that COVID’s lethality was very close to the seasonal flu (keep reading), Adhanom came back on TV to deliver apocalyptic predictions seemingly based on thin air:
Adhanom made a reference to the so-called Spanish flu in 1918 as a reference for the coronavirus outbreak. “It has a very dangerous combination and this is happening … like the 1918 flu that killed up to 100 million people,” he told reporters in Geneva.
Like the 1918 flu that killed up to 100 million people? When the WHO made that comparison, “only”’ (not to sound insensitive, just to put things into perspective here) 180,561 people worldwide had (allegedly) died from COVID.
But most of all, the estimated IFR based on dozens of serological studies worldwide was already close to the seasonal flu (most people use 0.1% for the flu, but the Robert Koch Institute in Germany argues the real number was closer to 0.5% during certain flu seasons), and definitely not close to the 1918 (so-called “Spanish flu”) which might have had an IFR of up to 7.5-15%.
One of these papers that stirred a lot of controversy is the serological (antibody testing) Santa Clara study, originally published by Stanford on April 17th.
That study was one of the first to confirm two key facts many scientists had already suspected: 1) COVID had spread way more than previously thought (50-85X more than “confirmed cases” in the Santa Clara county), which also meant that 2) COVID’s lethality is 50-85X smaller than previously thought. Researchers claimed the final lethality of COVID would be around 0.12-0.2%.
This study received massive backlash, possibly because a lot of people didn’t think it was safe for researcher John Ioannidis to claim that, “the IFR for this new coronavirus is likely to be in the same ballpark of the seasonal influenza.” Ioannidis admitted that there’s still a lot of uncertainty, but also that the initial lethality projections were completely wrong. These IFR projections have since been edited out of the study, because of statistical errors.
Here’s the thing though — while a lot of US media were myopically focused on how wrong this study might be, dozens of similar studies along with several worldwide experts were saying the exact same thing: COVID’s prevalence is much greater than previously thought, and its lethality rate will therefore be similar to the seasonal flu.
A) Studies or analyses showing that COVID’S Infection Fatality Rate (IFR) is similar to the seasonal flu:
- April 7th: Analysis from Finnish epidemiology professor Mikko Paunio from the University of Helsinki — 0.1% or less
- April 8th: Danish blood donor study — 0.06-0.14%
- April 17th: Latest data from Italy — 0.4%
- April 17th: Analysis by Prof. Johan Giesecke, one of the world’s most senior epidemiologists — 0.1%
- April 20th (last updated): Worldwide figures analyzed by data scientists — 0.06%
- April 24th: New York City serological study — 0.5%
- April 30th: Analysis from Dr. Donald Yealy — 0.25%
- April 30th (last updated): Analysis by Silverman et al. — 0.1%
- May 1st: Iran serological study — 0.08-0.12%
- May 4th: Study by Streeck et al. — 0.24-0.36%
- May 6th (last updated): Analysis by Oxford’s Centre for Evidence-Based Medicine — 0.1-0.41%
- May 19th: Analysis of 12 serological studies by Ioannidis — 0.02-0.4%
- May 21st: Estimation by Professor Sunetra Gupta from Oxford — 0.01-0.1%
This is not an exhaustive list by any means. Swiss Propaganda Research has put together this great list of 59 studies (PCR or serological) which, when averaged out, show an average IFR of 0.37% (regularly updated, these numbers might change).
The most recent and most shocking IFR analysis was published by the US CDC right before I was about to schedule this article. It shows an overall Symptomatic Case Fatality Rate of up to 0.4%. The CDC considers that 35% of people are asymptomatic, so this gives an IFR (risk of dying from COVID for the overall population) of 0.26%.
However, the CDC’s estimate of how many cases are asymptomatic is an eyebrow-raiser for sure, considering nearly all studies show that the real proportion of people who get COVID but never experience symptoms is closer to 70%, but the Swedes think it’s actually closer to 98-99%. If we calculate the CDC’s overall IFR based on these more realistic numbers, we get an IFR ranging from a minuscule 0.004% to 0.12% (same as seasonal flu).
B) Other serological studies show that COVID has spread much more widely than previously thought, which drops its fatality rate by orders of magnitude.
- United States, Colorado State: 0.8-3% (April 8th)
- Germany, municipality of Gangelt: 14% (April 9th)
- United States, Roseland Community Hospital in Chicago: 30-50% (April 9th)
- United States, New Castle county: 3% (April 14th)
- Finland: 3.4% (April 15th)
- Netherlands, blood donors: 3% (April 16th)
- United States, Chelsea: 32% (April 17th)
- Switzerland, Geneva county: 5.5%+ (April 17th)
- Sweden, nursing homes: 33% (April 19th)
- United States, L.A. county: 4.1% — prevalence 28 to 55X greater than confirmed cases (April 20th)
- Sweden, Stockholm area: 11% (April 21st)
- France, Oise department: 26% (April 23rd)
- United States, Miami-Dade county : 6% (April 24th)
- Sweden, Stockholm, analysis by Johan Giesecke: 30% (April 26th)
- United States, New York State: 12.3% — 19.9% in New York City (May 2nd)
- Japan, Kobe City: 2.7% — prevalence 400 to 800X greater than confirmed cases (May 5th)
- United Kingdom, mathematical modelling (not serology): 27% (May 7th)
- United Kingdom, London: 17% (May 21st)
C) World-class scientists and experts who agree that COVID’s lethality will be similar to the seasonal flu:
- “Approximately as dangerous as seasonal flu.” Mikko Paunio, epidemiology professor, University of Helsinki
- “Equally dangerous or even less dangerous than influenza.” John Ioannidis, professor of medicine, of epidemiology and population health, of biomedical data science, and of statistics, Stanford University
- “Like a severe influenza.” Johan Giesecke, one of the world’s most senior epidemiologists, Sweden
- “Akin to those of a severe seasonal influenza or a pandemic influenza.” Anthony Fauci himself, who advises the US government, in an editorial published in late February.
- “With Corona we are very, very far away from [the worst flu seasons].” Carsten Scheller, professor of virology, University of Würzburg
- “Akin to a bad winter influenza epidemic.” John Oxford, the world’s leading virologist and influenza specialist, Queen Mary University of London
- “No evidence that Covid-19 is causing huge loss of life.” Michael Levitt, winner of the 2013 Nobel in Chemistry, Stanford biophysicist
- “Not as bad as influenza.” Karin Mölling, internationally renowned virologist, former director of the Institute for Medical Virology in Zurich, Switzerland
- “This is nothing more than a flu epidemic if you care to look at the numbers and the data, but people who are in a state of anxiety are blind.” Yoram Lass, former Director-General of Israel’s Health Ministry
This list of studies, serological results and experts could be considered “cherry picked”, so let me clarify my point here in a few sentences:
- We do need more science to get the final word on the real lethality of COVID. As Prof. Giesecke recently said, “come back next year and I’ll tell you what the final numbers are”. (loose quote, couldn’t find the original source)
- That being said, there’s no way on Earth that COVID’s lethality will be close to the 1918 influenza, or even close to other coronaviruses “pandemics” like SARS in 2003 (9.6% CFR)
- If COVID’s lethality is way less than 1%, it begs into serious question if worldwide lockdowns were really warranted (more in Fact #5)
But the alarming fact for me is that all these predictions are only valid if every single one of the 300,000+ (May 22nd, Johns Hopkins map) “confirmed COVID deaths” are really deaths from COVID, and not from something else.
4.2 A Large Fraction Of “Confirmed” COVID Deaths Are Probably Due To Something Else
I’ve seen several discussions in the media about how COVID deaths are probably undercounted — because some countries don’t even have the necessary systems to count deaths in nursing homes (which represents 50%+ of COVID deaths in Europe and Canada) — but little discussion about how COVID deaths might be dramatically overcounted.
Let’s explore a few factors that might have contributed to artificially inflating the number of allegedly “confirmed” COVID deaths around the world.
A) The lack of distinction between deaths “with COVID” and “from COVID”
“Patient A” has pneumonia-like symptoms. So does “patient B”. Both die at the hospital.
Patient A’s death certificate shows “pneumonia”. After patient B’s death, doctors realize that the RT-PCR test results are in: he was COVID-positive. Cause of death: COVID. But is it the case?
Researchers around the world admit that it’s hard to tell in which instances COVID was really the causal agent in someone’s ultimate demise:
Finally, a major question that should be answered is the causal contribution of SARS-CoV-2 infection to related deaths. It is difficult to differentiate between deaths with SARS-CoV-2 infection and deaths caused by SARS-CoV-2 infection because the vast majority of patients who have died had 1 or more other major pathologies [emphasis mine] (98.8% with at least 1 comorbidity, and 48.6% having 3 or more diseases) that contributed to their death.
But these are older figures. The latest numbers (May 14th) out of Italy shows that not 48.6%, but around 60% of all COVID deaths in Italy had 3 or more simultaneous comorbidities.
So… was it COVID that killed all these patients? Or was it one of their 3+ comorbidities?
Four major data points have come out in the last few weeks that indicate the real death toll from COVID might need to be cut by a large margin:
- Italy: Re-evaluation of COVID deaths by the National Institute of Health in late March
As reported by SPG, Italian Professor Walter Ricciardi (President of their health agency) admitted that:
Only 12% of death certificates have shown a direct causality from coronavirus, whereas in public reports all the people who die in hospitals with the coronavirus are deemed to be dying of the coronavirus. ‘This means that Italian death figures reported by the media have to be reduced by at least a factor of 8 to obtain actual deaths caused by the virus. [emphasis mine] Thus one ends up with at most a few dozen deaths per day, compared to an overall daily mortality of 1800 deaths and up to 20,000 flu deaths per year’.
In other words, based on these numbers, out of 32,486 (alleged) COVID deaths in Italy (May 6th, Johns Hopkins map), we can argue that only 3,898 people died directly from COVID, and that 28,588 people died from other pathologies. In the latter cases, COVID might have been a contributor, but not the direct cause of their demise.
- Russia: Post-mortem autopsies required on 100% of cases
National Post has recently reported that Russia slashed 60% of their COVID deaths in April, a fact that made a lot of people question the veracity of their numbers. But Russian officials maintain that they removed these deaths from the official death count because they had clearly not been caused by COVID.
But it flatly denied it had been dishonestly lowering the Russian capital’s coronavirus death toll. Tatyana Golikova, Russia’s health minister, has also denied any falsification of the statistics.
Unlike many other countries, Moscow’s department of health said it and Russia conducted post-mortem autopsies in 100% of deaths where coronavirus was suspected as the main cause. “Therefore, post-mortem diagnoses and causes of death recorded in Moscow are ultimately extremely accurate, and mortality data is completely transparent,” it said. [emphasis mine]
“It’s impossible in other COVID-19 cases to name the cause of death. So, for example in over 60% of deaths the cause was clearly for different reasons such as vascular failures (such as heart attacks), stage 4 malignant diseases, leukemia, systemic diseases which involve organ failure, and other incurable fatal diseases.”
- USA, State of Colorado: Started reporting the real number of people who died “from” COVID, death toll drops by 25%
The Colorado State has faced a lot of pressure to report the real number of people who died “from” COVID, after it’s been found that a man who likely died from alcohol overdose was considered a COVID death.
The official death toll (died from COVID) has therefore decreased by 25%. The State still reports deaths among COVID-positive patients on their website, since this is the statistic that is being used on a Federal level.
Ironically, even Dr. Birx, head of the White House’s COVID response team, recently said that she thinks the death toll is inflated by 25%. She even added “There is nothing from the CDC that I can trust.”
- Germany: Evaluation of test-positive COVID deaths by forensic medicine
The German Robert Koch Institute (RKI) advised against autopsies of COVID deaths in early April, allegedly because of the risk of droplet infection by aerosols.
A German specialist in pathology commented on this decision:
“Who might think evil of it! Up to now, it has been a matter of course for pathologists to carry out autopsies with appropriate safety precautions even in the case of infectious diseases such as HIV/AIDS, hepatitis, tuberculosis, PRION diseases, etc.
It is quite remarkable that in a disease that is killing thousands of patients all over the world and bringing the economy of entire countries to a virtual standstill, only very few autopsy findings are available (six patients from China). From the point of view of both the epidemic police and the scientific community, there should be a particularly high level of public interest in autopsy findings.
However, the opposite is the case. Are you afraid of finding out the true causes of death of the positively tested deceased? Could it be that the numbers of corona deaths would then melt away like snow in the spring sun?” [emphasis mine]
The Hamburg health authority decided to ignore the RKI’s guidance — and started to resort to forensic medicine to determine which people died “from” COVID, and which “with” COVID.
Their findings? So far, 94% of all alleged COVID deaths in Hamburg were causative, and 6% were not. This is based on a small sample size, but we need to urgently do autopsies in larger amounts to be able to determine the real causes of death in several countries.
Professor Klaus Püschel, forensic doctor at the University Medical Center Hamburg-Eppendorf (UKE), commented:
In quite a few cases, we have also found that the current corona infection has nothing whatsoever to do with the fatal outcome because other causes of death are present, for example a brain haemorrhage or a heart attack.
Corona in itself is a “not particularly dangerous viral disease”, says the forensic scientist. He pleads for statistics based on concrete examination results. “All speculations about individual deaths that have not been expertly examined only fuel anxiety.” [emphasis mine] (SPG)
The Federal Association of German Pathologists agrees with Prof. Püschel’s assessment, and stated that that there must be autopsies of COVID deaths in order to determine the real cause of death.
Possibly facing pressure from pathologists and the public, the Robert Koch Institute ended up completely reversing their recommendation to not conduct autopsies for COVID deaths, stating that “especially when the disease is new, it is important to do as much autopsy as possible.”
In the UK, The Royal College of Pathologists agrees that “there should be detailed investigations to establish the different causes of deaths during the covid-19 pandemic” — but that unfortunately these investigations will be done later in the Fall.
In the meantime, the very concerning reality is that some health officials admitted that in their opinion, everyone who dies with COVID will be considered a COVID death — even when when COVID is clearly not the cause of death:
Dr. Ngozi Ezike, Illinois Department of Public Health:
I just want to be clear in terms of the definition of people dying of COVID. The case definition is very simplistic. It means: at the time of death, it was a COVID-positive diagnosis. That means that if you were in hospice and had already been given a few weeks to live, and then you also were found to have covid, that would be counted as a covid death.
Technically, even if you died of a clear alternate cause but you had covid at the same time, it’s still listed as a covid death. [emphasis mine] Everyone who’s listed as a COVID death doesn’t mean that was the cause of the death, but they had COVID at the time of death. (source)
Rudi Anschober and Bernhard Benka, members of the Corona Task Force in the Ministry of Health of Austria:
There is a clear rule at present: Died with the corona virus or died from the corona virus both count for the statistics. No difference is made as to what the patient actually died of.
In other words, a 90-year-old man who dies with a fracture of the femoral neck and becomes infected with corona in the hours prior to his death is also counted as COVID death, [emphasis mine] to name one example. (source)
B) The very real possibility that most people who died from COVID would “have died anyway” that same year, but from other causes
Even if I likely sound like a broken record by now… exceptions are not the norm. Yes, there have been a few people who tragically died of COVID and who were young, seemingly healthy, and who had no known underlying conditions.
But remember: the vast majority of people who allegedly died from COVID had an average age of 80 to 84 years old (varies from country to country), and one or more pre-existing conditions. More than 50% of all COVID deaths in Canada and most of Europe were in nursing homes — where residents unfortunately represent the “perfect” risk group.
After reviewing these facts, health officials in Quebec, Canada (where I live) made a stunning admission during a press conference on April 22nd that left me speechless:
I want to remind everyone that every year, there’s around 1,000 people who die in nursing homes every month. It’s important to understand that the deaths we currently consider deaths from COVID-19 would have happened even without this situation. [emphasis mine, translation mine]
Wait a minute… is there, or is there not a deadly new virus that supposedly killed 3,800 in Quebec alone (May 22nd) — 3,230 (around 85%) of which happened in nursing homes?
Are you saying that COVID really killed 570 people, considering these nursing homes deaths “would have happened regardless of COVID”? Unsurprisingly, no media reported on that admission, except web-based independent journalist Alexis Cossette-Trudel from Radio-Québec.
But this is not a one-time slip up: Several scientists and politicians around the world admitted that many or even most people who died from COVID “would have died anyway”. A few examples:
- Professor Sir David Spiegelhalter, statistician at Cambridge University: “Many people who die of COVID would have died anyway within a short period.” (source)
- Professor Neil Ferguson from the Imperial College London, AKA “Mr. Lockdown” himself (more on Ferguson in Fact #5): “The proportion of COVID victims who would have died anyway could be ‘as many as half or two-thirds’.” (source)
- Professor Klaus Püschel, forensic doctor at the University Medical Center Hamburg-Eppendorf (UKE): “All of his autopsies who died of COVID had previous illnesses and would not have survived this year anyway.” (source)
- Professor Karol Sikora, Founding Dean and Professor of Medicine at the University of Buckingham Medical School and an ex-director of the WHO Cancer Programme: “A lot of the people that died from COVID would have died anyway, sadly, in that period.” (source)
We also need to consider that as reported in Conservative Review (I don’t care what political affiliation they might have or you might have… I’m just a Canadian anyway), “we know that 65% of nursing home residents die every year within a year of admission and 52% within six months.” Also consider that “the Illinois health director admitted that ‘if you were in hospice and had already been given a few weeks to live and then you also were found to have COVID, that would be counted as a COVID death.'”
C) Flu deaths have “disappeared” in the US
No conspiracy theory here, sorry for the folks who like those. Instead, let me propose that the way everyone in the US has been encouraged and incentivized to generously categorize all deaths from flu-like illnesses as “COVID” has created massive confusion.
On normal years, the flu season starts on October 1st, hits hard in January and February, and tapers off gradually in late April or early May. The overall graph of flu-positive tests looked like this during the 2018-2019 influenza season, from October 1st to May 18th (flu week #20):
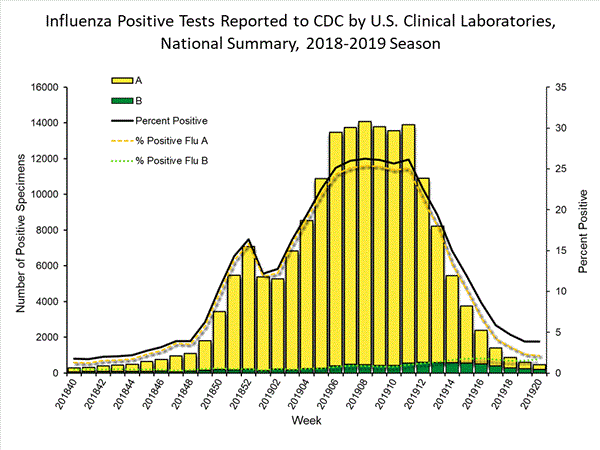
Source: CDC Weekly Influenza Surveillance Report, 2018-2019 Season, Week 20 ending May 18, 2019
And here’s how it now looks like this year, up until week #17 (ending on April 15th), in the middle of the COVID crisis:
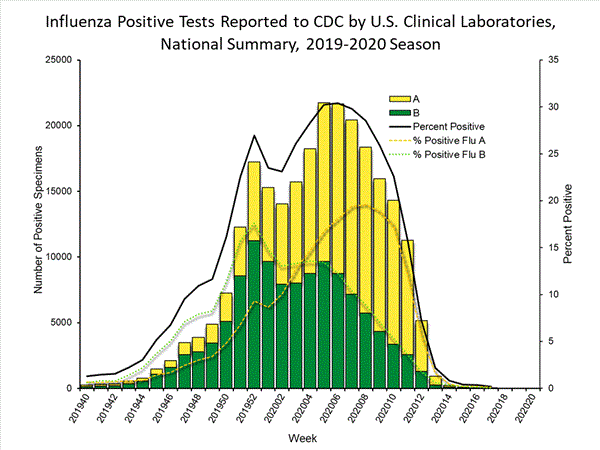
Source: CDC Weekly Influenza Surveillance Report, 2019-2020 Season, Week 17 ending April 25th, 2020.
Hidden in the comments of a blog post, an informed commenter explained that this drop in flu detection rates is almost mathematically impossible:
Has anyone looked at the CDC Flu Surveillance reports lately? These reports are weekly and they have been doing them for 20 years now. Without going into them into too much detail here are some recent anomalies that are quite striking — not sure what to make of them. […]
In Weeks 12,13,14 (the latest reported) those positive specimen percentages for the flu went down from 6.9%, 2.1% and 0.8% respectively. This after all time highs in weeks 6,7,8 of 30.8%, 29.6% and 26.4% respectively. […]
I’ve charted all of this data for the last 10 years — Weeks 6-14 — and when you see it in graphs the statistical deviation of the last 3 weeks of flu positives as recorded by the CDC is jaw dropping — we are talking aberrations on the order of 600-900 percent [emphasis mine] — that is not a typo. On average Week 14 flu positives over the last 10 years has been 13.5% and this year it is at 0.8%? That’s simply not possible. What gives?
How can you go from reporting flu numbers of around 13 percent in Week 14 for twenty years to 0.8 percent this year during a time when you want everyone’s attention to be on this other virus — this is a deviation over 1,500 percent. […] Something smells rotten here.
The flu season has been so calm that the CDC has recently stated on their website that “with ongoing declines in influenza activity and the continued effects of the COVID-19 pandemic, FluView will be abbreviated for the remainder of the 2019-2020 season.”
I’ve added the full data below for your reviewing pleasure:
% of Flu-Positive Specimens — Weeks 9 to 13 (dates are approx.)
| Flu Season | Week 9 (Mar 3) | Week 10 (Mar 10) | Week 11 (Mar 17) | Week 12 (Mar 24) | Week 13 (Mar 31) |
| 2019-2020 (provisional numbers) |
24.3% | 21.5% | 15.3% | 6.9% | 2.1% |
2018-2019 |
26.1% | 25.8% | 26% | 22.1% | 18.1% |
2017-2018 |
17.7% | 15% | 15.3% | 14.7% | 15.4% |
Source: CDC FluView Past Weekly Surveillance Reports
% of Flu-Positive Specimens — Weeks 14 to 18 (dates are approx.)
| Flu Season | Week 14 (Apr 7) | Week 15 (Apr 14) | Week 16 (Apr 21) | Week 17 (Apr 28) | Week 18 (May 5) |
| 2019-2020 (provisional numbers) |
0.8% | 0.4% | 0.4% | 0.2% | N/A |
2018-2019 |
15.1% | 8.1% | 26% | 5.4% | 4.7% |
2017-2018 |
12.8% | 8.9% | 15.3% | 7.4% | 6.5% |
Source: CDC FluView Past Weekly Surveillance Reports
What about flu deaths? They seem to have suddenly disappeared as well. From January 1st to May 7th, the National Vital Statistics System Provisional Death Counts for Coronavirus Disease (COVID-19) reports 45,632 COVID deaths, 71,451 pneumonia deaths, but only 6,000 deaths from influenza.
Based on previous seasons, one would have expected anywhere from 15,000 to 30,000 flu deaths so far in 2020. Bizarrely, the CDC still reports that after extrapolating the current provisional numbers, they expect 24,000 to 62,000 deaths from the flu during the 2019-2020 season. If someone has any logical explanation for this phenomenon, please let me know.
D) New COVID infections and new COVID deaths follow each other in a mathematically and biologically-impossible pattern
Christof Kuhbandner, professor in psychology at the Regensburg University, has been scratching his head when looking at one specific problem he discovered in the COVID data coming out of the Robert Koch Institute in Germany:
There is another striking second point. To see this, you have to compare the progression curves for the new infections and the deaths. In order to be able to compare the two curves well, the number of new infections is brought up to the level of the number of deaths in the following graphic using the current death rate.
In practical terms, this means that we plot the course of the new infections so that it shows how many people should die from it at some point in the future, according to the death rate. The following picture then appears. (Note: According to the data from the data download source NPGEO Corona Hub 2020, the reporting date corresponds to the date when the case became known to the health department. However, it remains unclear whether this corresponds to the actual death date.)
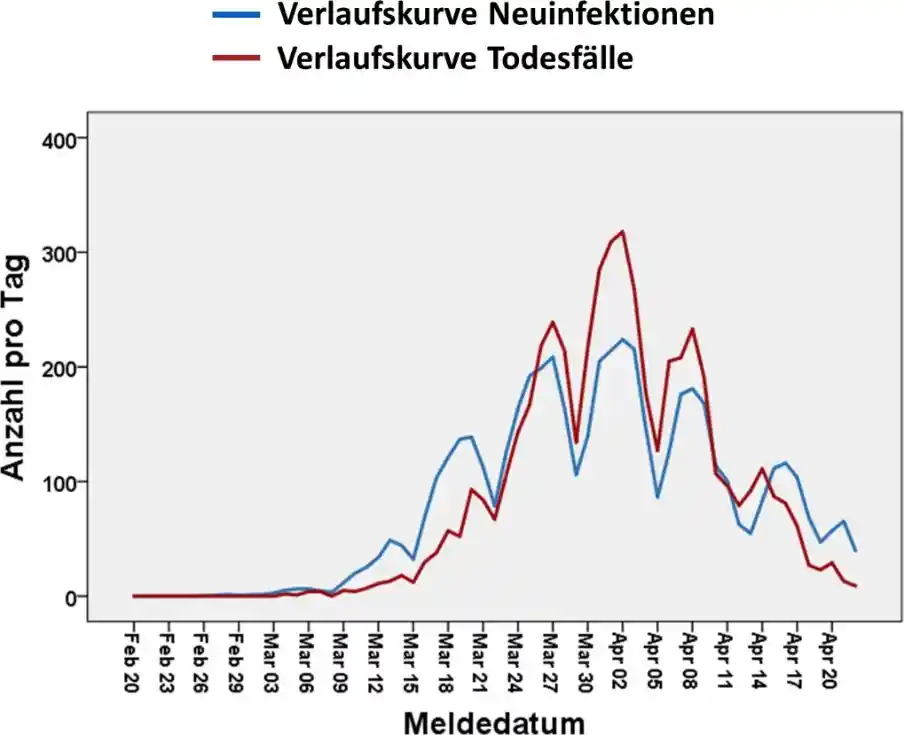
In blue: Trajectory of new COVID infections. In red: Trajectory of new COVID deaths.
Image credit: Prof. Christof Kuhbandner.
Kuhbandner continues:
Here is a very strange pattern: The number of new infections and the number of deaths increases and decreases practically exactly in parallel. From a biological perspective, this is actually impossible, because according to studies, there are 18 days between the development of the first symptoms of the disease and the time of death. [emphasis mine] So even if you assume that a test is only carried out eight days after symptom formation, the death curve should lag the new infection curve by 10 days.
The only reasonable explanation for the lack of a time lag between new infections and deaths could be that many of the deceased were tested for the coronavirus just before or after death. This then implies two options:
Option A: The deceased really died of COVID. But that would mean that you would have found the exact same growth curve for new infections 10 days prior.
Option B: The deceased only caught the coronavirus shortly before death and in reality did not die of it. That would mean, however, that both curves actually show the same thing: an increase in the number of new tests that was dramatically distorted by the number of tests.
E) The inclusion of “probable” COVID deaths worldwide have likely been inflating the death toll dramatically
We’ve already established in Fact #2 that doctors are unable to clinically differentiate COVID from other causes of pneumonias or other flu-like illnesses 96% of the time. Remember this as we move forward.
Now consider that just like it happened with COVID cases (Fact #1), health authorities around the world have decided to start adding “probable” COVID deaths to the official death toll — without having to first confirm the presence of the virus with a (potentially bogus) RT-PCR test or perform an autopsy to determine whether the real cause of death was indeed “COVID”.
Again — to be fair — adding “probable” deaths to the official death toll can technically be a somewhat helpful way to make sure you don’t underestimate how many COVID deaths there really are, an underestimation which could have resulted in you missing a key opportunity to adjust your health policies and interventions in time to save lives. But this inclusion can also lead to a devastating overestimation of COVID deaths — especially when doctors are basically unable to recognize COVID based on symptomology alone.
WHO’s guidelines on how to code COVID deaths (updated on April 20th), confirm that “COVID-19 should be recorded on the medical certificate of cause of death for ALL decedents where the disease caused, or is assumed to have caused, or contributed to death.” [emphasis mine]
Following the WHO’s lead, most countries have been adding these probable deaths to their official toll. A few examples:
- United Kingdom: The guidance to medical practitioners states: “If before death the patient had symptoms typical of COVID 19 infection, but the test result has not been received, it would be satisfactory to give ‘COVID-19’ as the cause of death, tick Box B and then share the test result when it becomes available. In the circumstances of there being no swab, it is satisfactory to apply clinical judgement.”
- United States, overall: The National Vital Statistics System (NVSS) Guidance for Certifying Deaths Due to Coronavirus Disease 2019 (COVID–19) specifies that “COVID-19 should be reported on the death certificate for all decedents where the disease caused or is assumed to have caused or contributed to death.” On April 14th, the CDC changed its guidelines, making it so that case counts and death counts started including both confirmed and probable cases and deaths.
- United States, New York City: Following the April 14th CDC guidance, NYC officials have decided to include people who never tested positive to total deaths from COVID (so-called probable deaths). This increased the death toll by 3,700, which represented a bump of around 56% at the time.
- Belgium: As of April 22nd, Belgium had 6,262 deaths from COVID, 3,256 of them being in nursing homes. Out of these 3,256 nursing homes deaths, only 146 (4.5%) had been confirmed via a test, while 3,110 (95.5%) are suspected. “Even Prime Minister Sophie Wilmès has suggested the count has been exaggerated.”
Several doctors, scientists and politicians have expressed concerns that the inclusion of these “probable” deaths might be artificially increasing the COVID death toll, and creating unnecessary panic.
Prof. Wittkowski commented, when asked “what do you make of the CDC and the WHO guidance to assume COVID-19 when coding deaths?”:
This is one way to artificially inflate numbers to give the politicians a bit of… (hesitates) to cover their gluteus maximus.
Minnesota State Senator Scott Jensen, a politician who also happens to be an MD, was so shocked by the situation that he appeared in multiple media outlets to sound the alarm:
I had never seen something like that before. All of a sudden, I read this document from the Department of Health and it said ‘go ahead and diagnose COVID-19’… it didn’t say ‘put down probable’ — it said ‘go ahead and’… I went to the CDC document, and that flies completely in the face of the manual that CDC puts out on how death certificates should be filled out.
In the manual, it talks about specificity and precision. And all of a sudden we’re being told ‘well, if it’s reasonable, if it’s likely, if it’s probable, if it’s presumptive, go ahead and put that down’. [emphasis mine]
That is what caused me to raise this up the flagpole […] I’ve never been coached or told before that this is what I need to do. I checked with 50 to 75 physicians in Minnesota and none of them could remember it either. We didn’t have that happen in 2018 when we had 60,000 to 80,000 deaths from influenza. If I diagnose ‘pneumonia’ and put that down on the death certificate, nobody was telling me to put influenza on it as well, if I’m in the middle of a flu epidemic. If I didn’t test for it, […] then I certainly shouldn’t be putting it on the death certificate.
4.3 A Large Fraction Of “Excess” Deaths Might Have Been Caused By The Panic, Not COVID
It’s been increasingly clear that the death statistics for COVID are utterly unreliable.
As I’ve said countless times in my last article, if we can’t trust the official death toll or even flu-like illnesses statistics that are being reported, the next best thing we can do to assess how much of a health threat COVID represents is to keep an eye on the overall mortality in a specific region, country or continent.
If we do see a spike in overall mortality (“excess mortality”) this year compared to previous years, then it will become clear that at least something is up. Then, the next step will be to determine whether the cause of this spike in mortality is: 1) COVID itself, 2) the side effects of the COVID lockdowns or interventions, or 3) a bit of both.
COVID has hit different countries or even different cities in strikingly different ways. The death toll is minuscule in Japan, Taiwan and South Korea, but has been described as ‘apocalyptic’ in New York City, Italy and Spain.
On April 21st, the New York Times reported that there were 46,000 “missing deaths” due to COVID. This number was updated to 63,000 on May 7th.
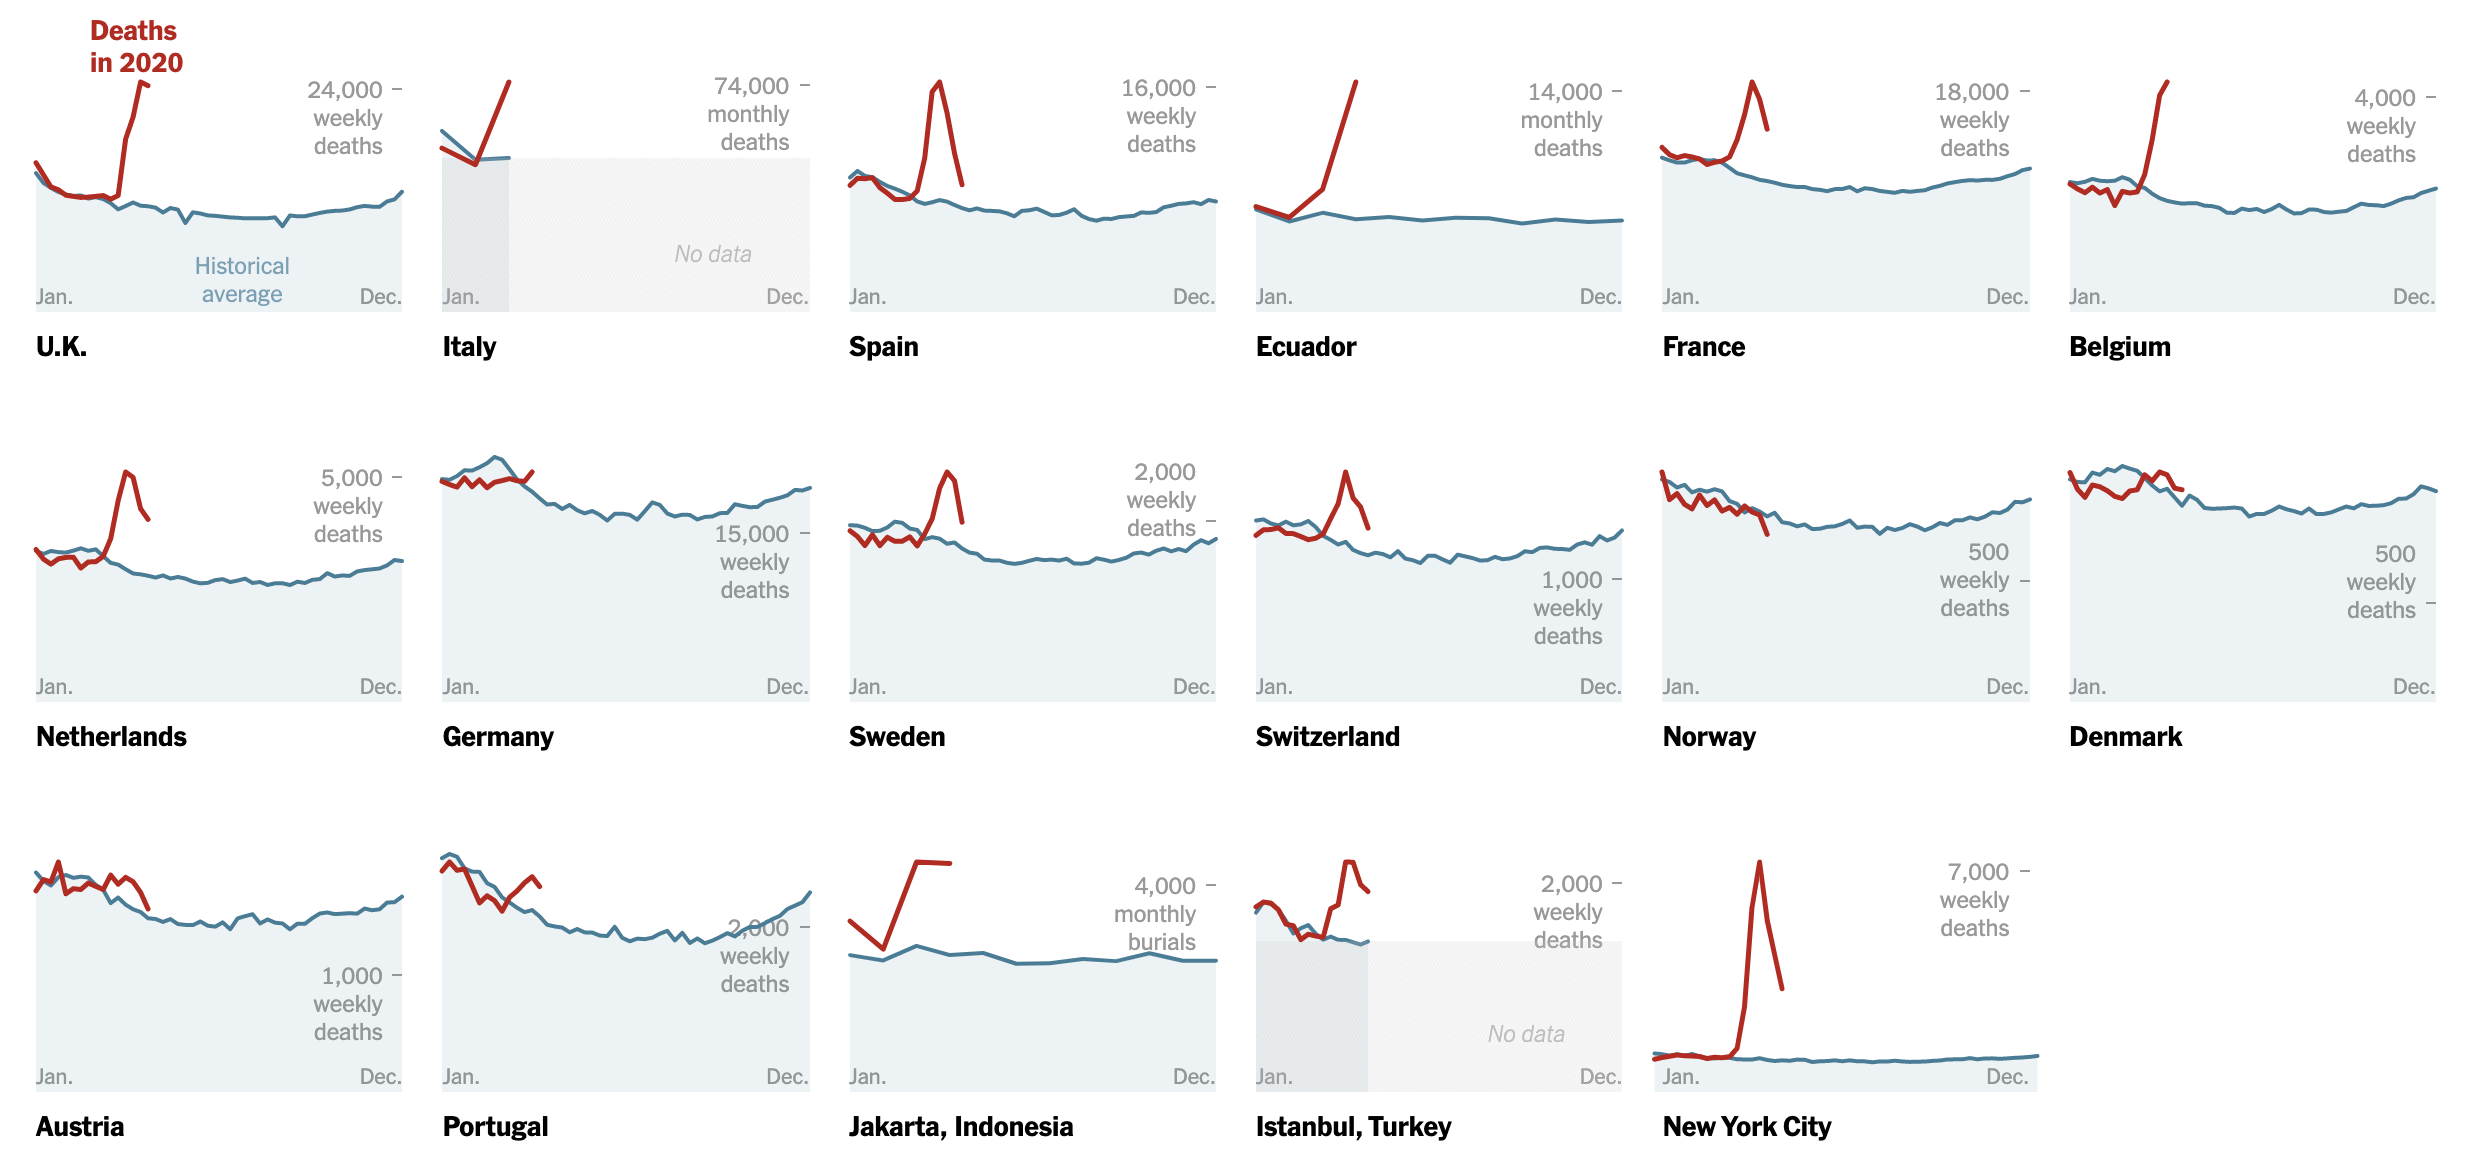
Peaks of excess mortality in various countries. Image source: New York Times
There’s no denying that there is “excess mortality” in many countries around the world. But putting forward the idea that all these deaths are just due to COVID is yet another demonstration of the confirmation bias the New York Times has displayed throughout this entire crisis: “It must be COVID”.
What they fail to acknowledge is that:
- There’s excess mortality every Winter during every wave of seasonal flu
- These peaks in excess mortality are, in several countries, comparable to deadly flu seasons from past years — flu seasons that didn’t trigger massive panic, lockdowns or any of that stuff
- There are already a lot of indications that at least a significant proportion of these deaths are not related to COVID, but to something else — including the side effects of COVID-related lockdowns
To get a fair analysis, one needs to look at how this spike in overall mortality compares to other flu seasons, and then try to figure out what proportion of these deaths might be due to COVID, and what proportion might be due to other factors, which include the panic caused by COVID. Let’s take a look.
Europe — Excess mortality
The European monitoring of excess mortality for public action (EuroMOMO) now shows that the peak of excess deaths in Europe has clearly surpassed the 2016-2017 flu season.

Source: EuroMOMO
The good news is that these excess deaths have already peaked in early April and are steadily dropping.
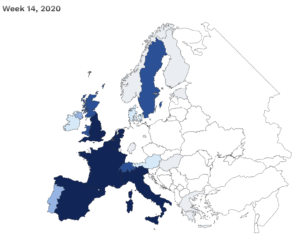
Week 14 (ending on April 5th) was the most deadly so far. The darker the color, the more excess deaths. |
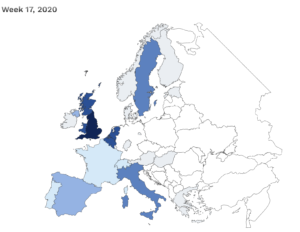
On Week 17 (ending on April 26th) shows a dramatic decline across the board, except in the UK. |
United Kingdom — Excess deaths, large proportion likely not due to COVID
Put together by a concerned UK citizen, the “InProportion2” website aims to compare the current COVID crisis to past pandemics (including past flu seasons), in order to give readers some perspective.
How bad has it really been in the UK? As InProportion2 explains on its homepage:
Much of the media provides a continual stream of sensational headlines about Covid such as “Death tolls soar as …” or “Worst week since records began for…” but it must be asked if such fear generating approach has been justified or helpful. For most of 2020 so far, overall mortality levels have been below those of 2018. [emphasis mine]
As far as the death toll goes, even if we take the death numbers at face value (which we shouldn’t), COVID will likely end up being less deadly than several past flu seasons.
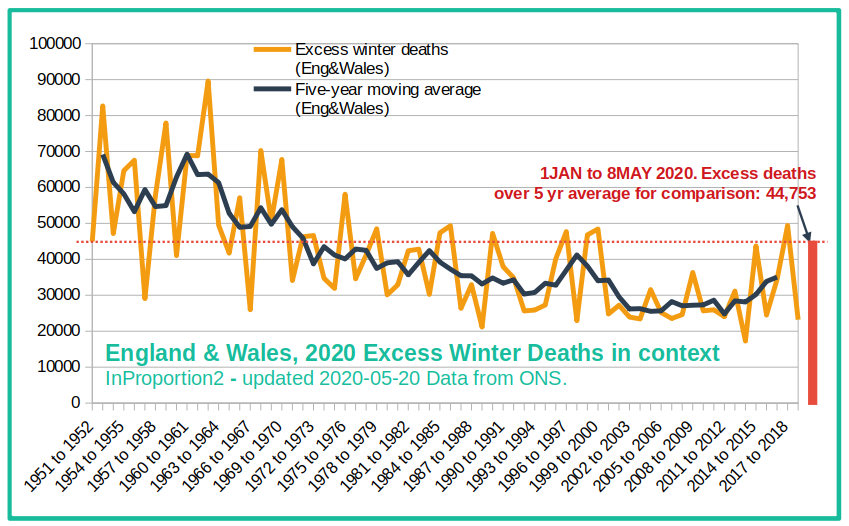
Image source: InProportion2
“InProportion2” has also identified that a large fraction of the excess mortality the UK has been seeing is due to factors outside of COVID, and possibly to the side effects of the lockdown or overall panic:
Could lockdown be a cause of excess deaths short-term as well as long term? In the long term, there will be a huge price to pay for the lockdown in terms of damage to the economy and in knock-on effects to health and mortality. Everyone expects this. However, it may be that the impact of the lockdown is already having a measurable impact on mortality!
In the four most recent weeks covered by the ONS data, compared to the 5 year average, an excess of 11,261 deaths occurred not attributed to Covid. [emphasis mine]
Did some of the 11,261 die as a result of a reduction in the delivery of normal hospital services due to the lockdown? Are thousands already paying for the lockdown with their lives?
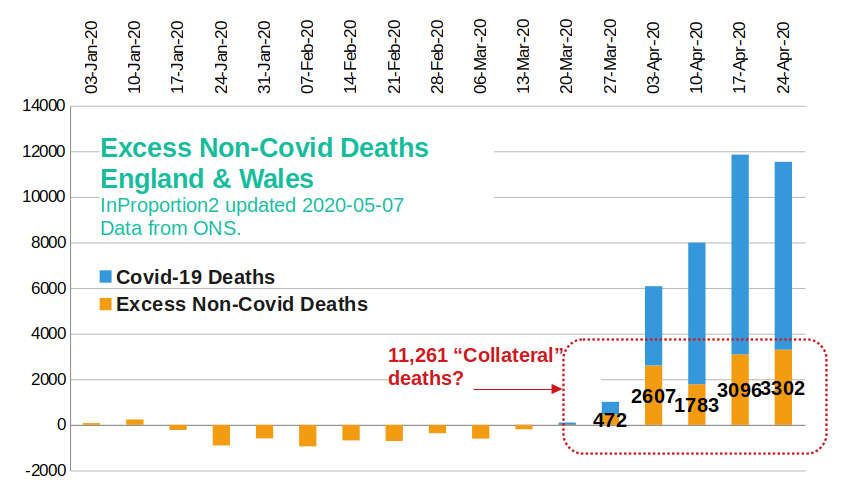
Image source: InProportion2
Several weeks ago, the UK’s National Health Service admitted that they feared the potential rise in non-COVID deaths:
There could be some very serious unintended consequences [to all the resources going into fighting coronavirus]. While there will be a lot of covid-19 fatalities, we could end up losing more ‘years of life’ because of fatalities relating to non-covid-19 health complications.
These fears have already started becoming reality:
A new analysis by Edge Health, a leading provider of data to NHS trusts, warns that a second and then a third wave of “non-corona” deaths are about to hit Britain. Unless radical solutions can be found to resume normal service and slash waiting lists, the NHS may be forced to institute a formal regime of rationing.
The “second wave” is already breaking. It is made up of non-coronavirus patients not able or willing to access healthcare because of the crisis. Based on ONS and NHS data, Edge Health estimates these deaths now total approximately 10,000 and are running at around 2,000 a week. [emphasis mine]
They include a wide range of typical emergency admissions, including stroke and heart attack patients, as well as those with long term chronic conditions such as diabetes who are not able to access the primary or secondary care services they need. Many are sadly dying in their homes. Others are just getting to hospital too late.
David Spiegelhalter, chair of the Winton Centre for Risk and Evidence Communication at the University of Cambridge, has come to similar conclusions:
David Spiegelhalter […]said that covid-19 did not explain the high number of deaths taking place in the community. At a briefing hosted by the Science Media Centre on 12 May he explained that, over the past five weeks, care homes and other community settings had had to deal with a “staggering burden” of 30 000 more deaths than would normally be expected, as patients were moved out of hospitals that were anticipating high demand for beds.
Of those 30 000, only 10 000 have had covid-19 specified on the death certificate. [emphasis mine] While Spiegelhalter acknowledged that some of these “excess deaths” might be the result of underdiagnosis, “the huge number of unexplained extra deaths in homes and care homes is extraordinary. When we look back . . . this rise in non-covid extra deaths outside the hospital is something I hope will be given really severe attention.”
Finally, as reported by SPG, “The editor of the British Spectator has claimed that government agencies expect the lockdown to result in up to 150,000 additional deaths in the longer term, significantly more than what COVID is expected to cause.”
The exact same phenomenon has been described in Canada and other countries, where patients fear going to the hospital. (this will be explored further in Fact #5)
I want to make an important distinction here: If these extra deaths are due to hospitals being overwhelmed because of COVID-related hospitalization, then it would make sense to consider them part of the COVID toll. This is the unfortunate worst case scenario we’ve been told could happen if we didn’t “flatten the curve” enough.
But if these deaths are merely the consequence of the “Corona-Panic”, which — for example — makes patients fear going to the hospital, then we’ve made a terrible mistake, and our reaction to the virus might have been more dangerous than the virus itself.
Germany — No excess mortality
In Germany, a lot of deaths have been attributed to COVID (more than 8,000), but overall mortality has stayed comparable to previous years.
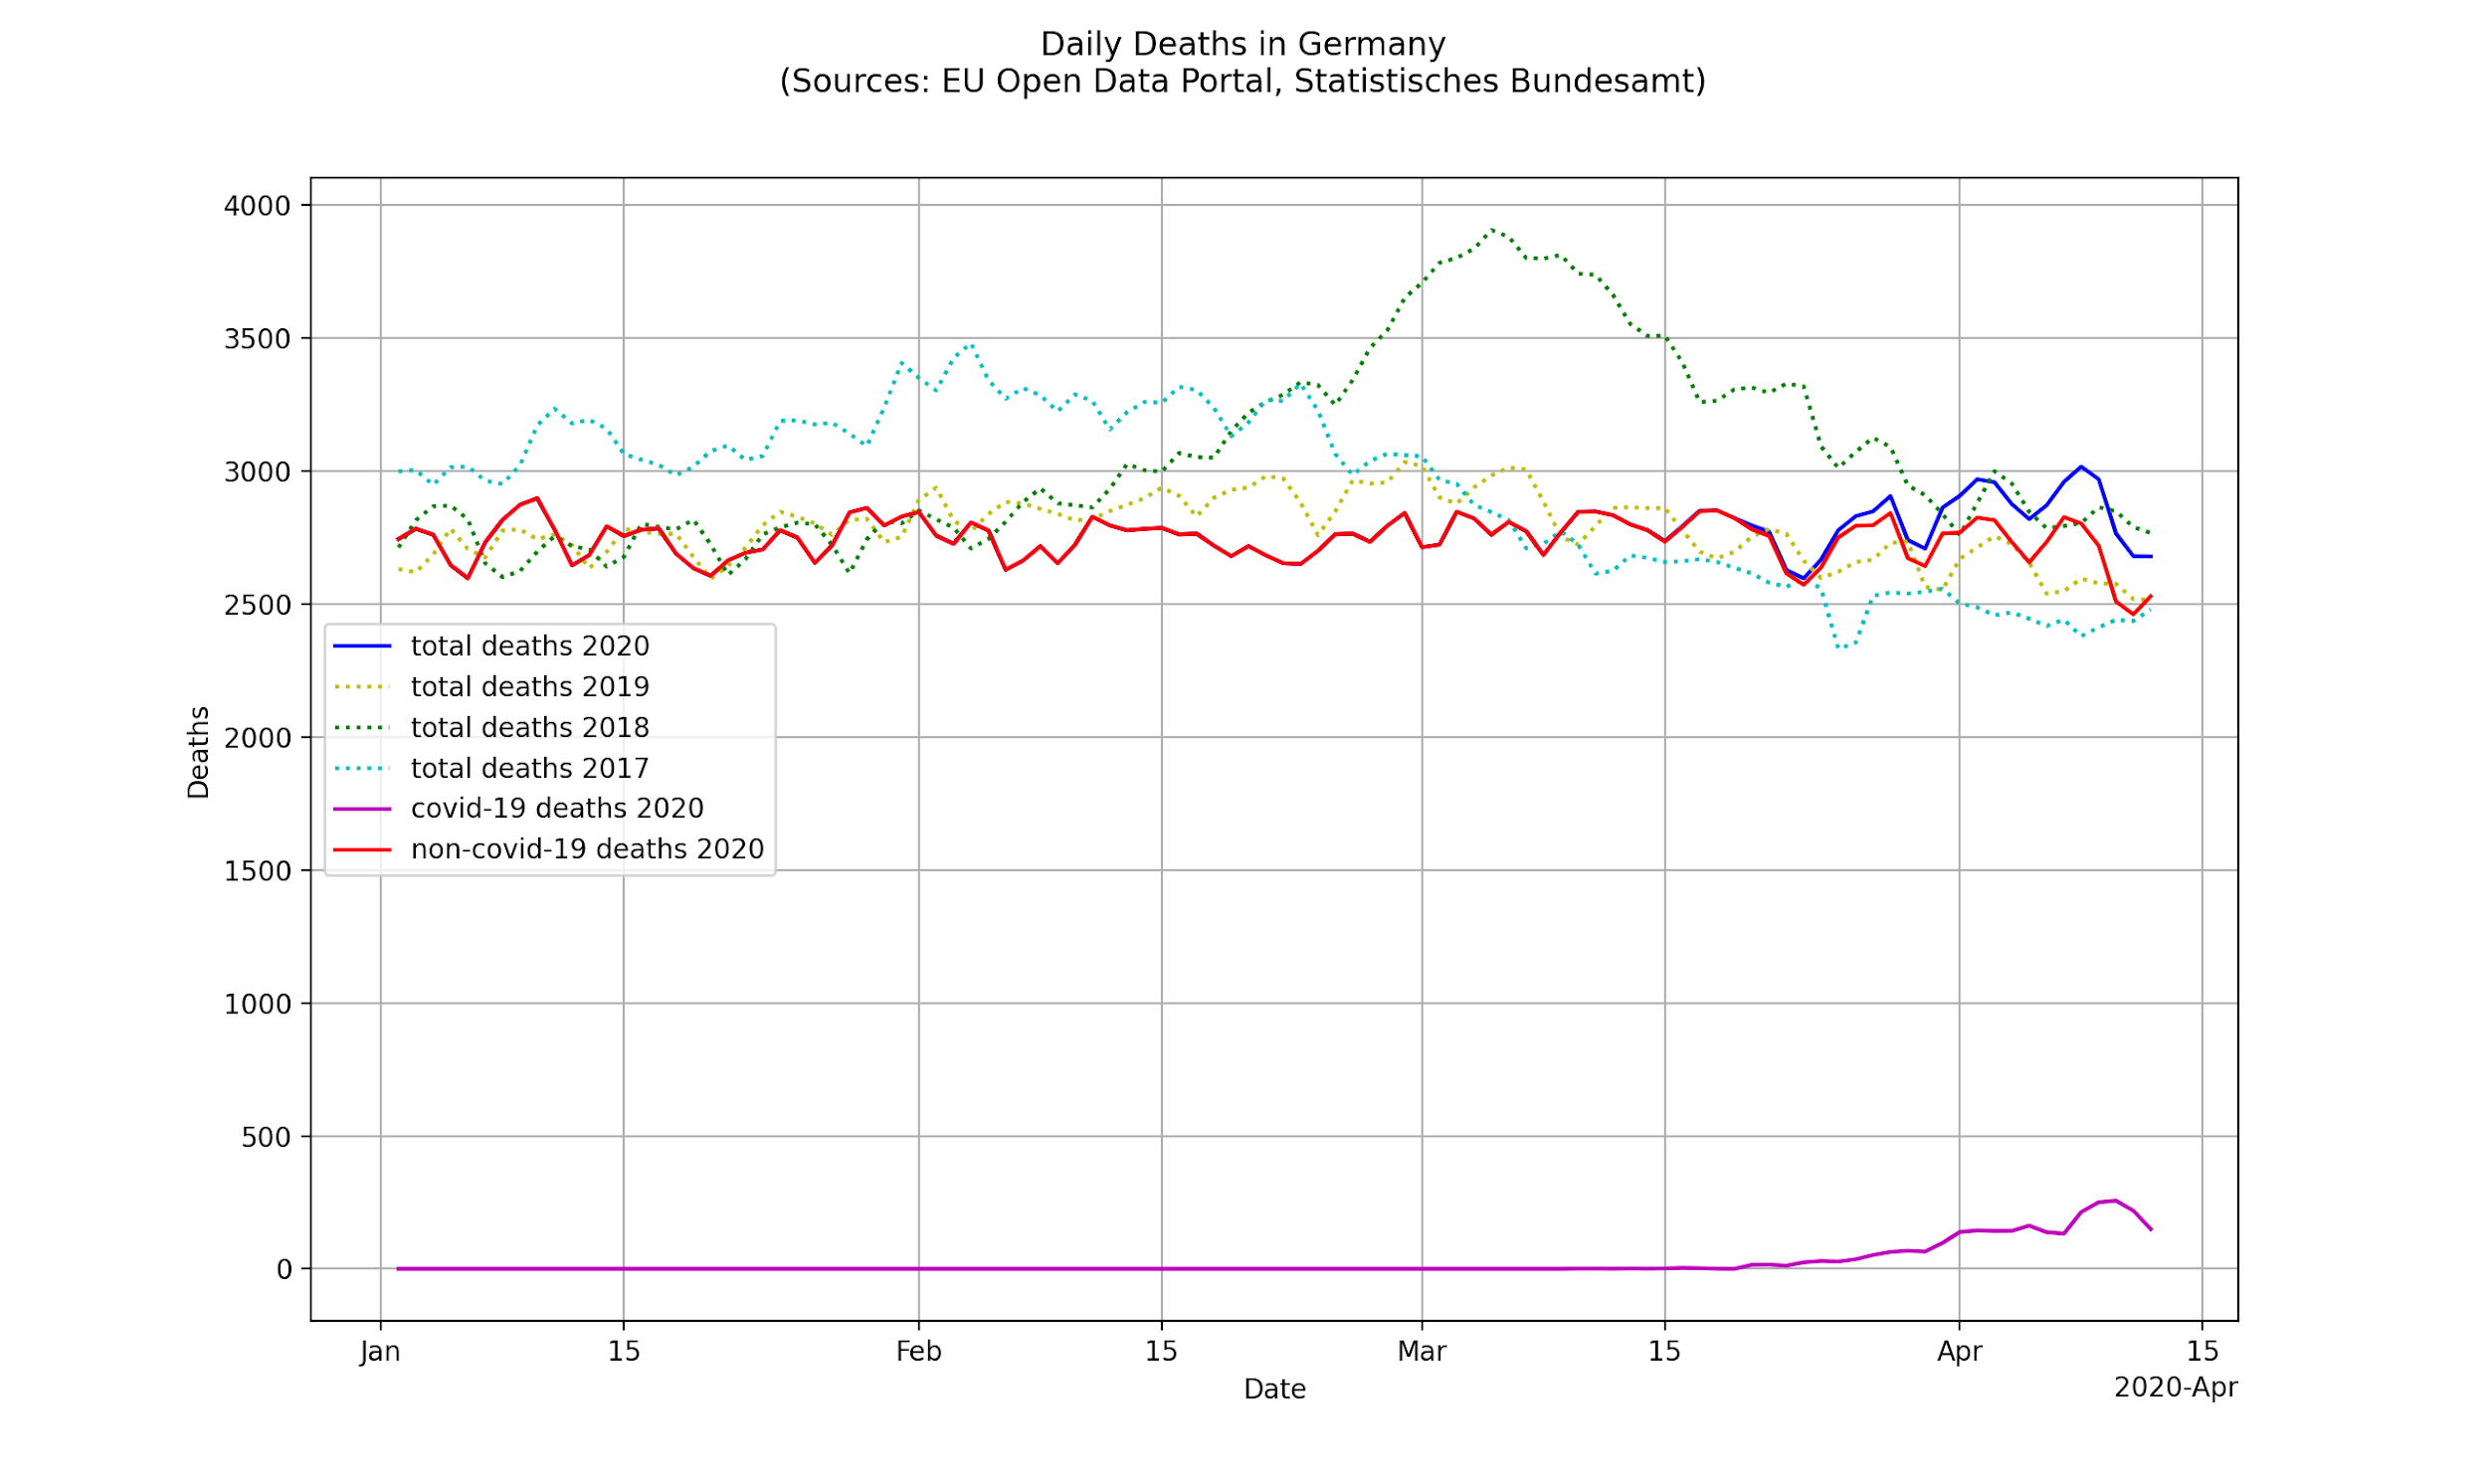
Image source: Wolfgang Wodarg
The latest report (Week 18) from the Robert Koch Institute (RKI) shows that mortality from flu-like illnesses is in fact lower than previous years, and is steadily falling:
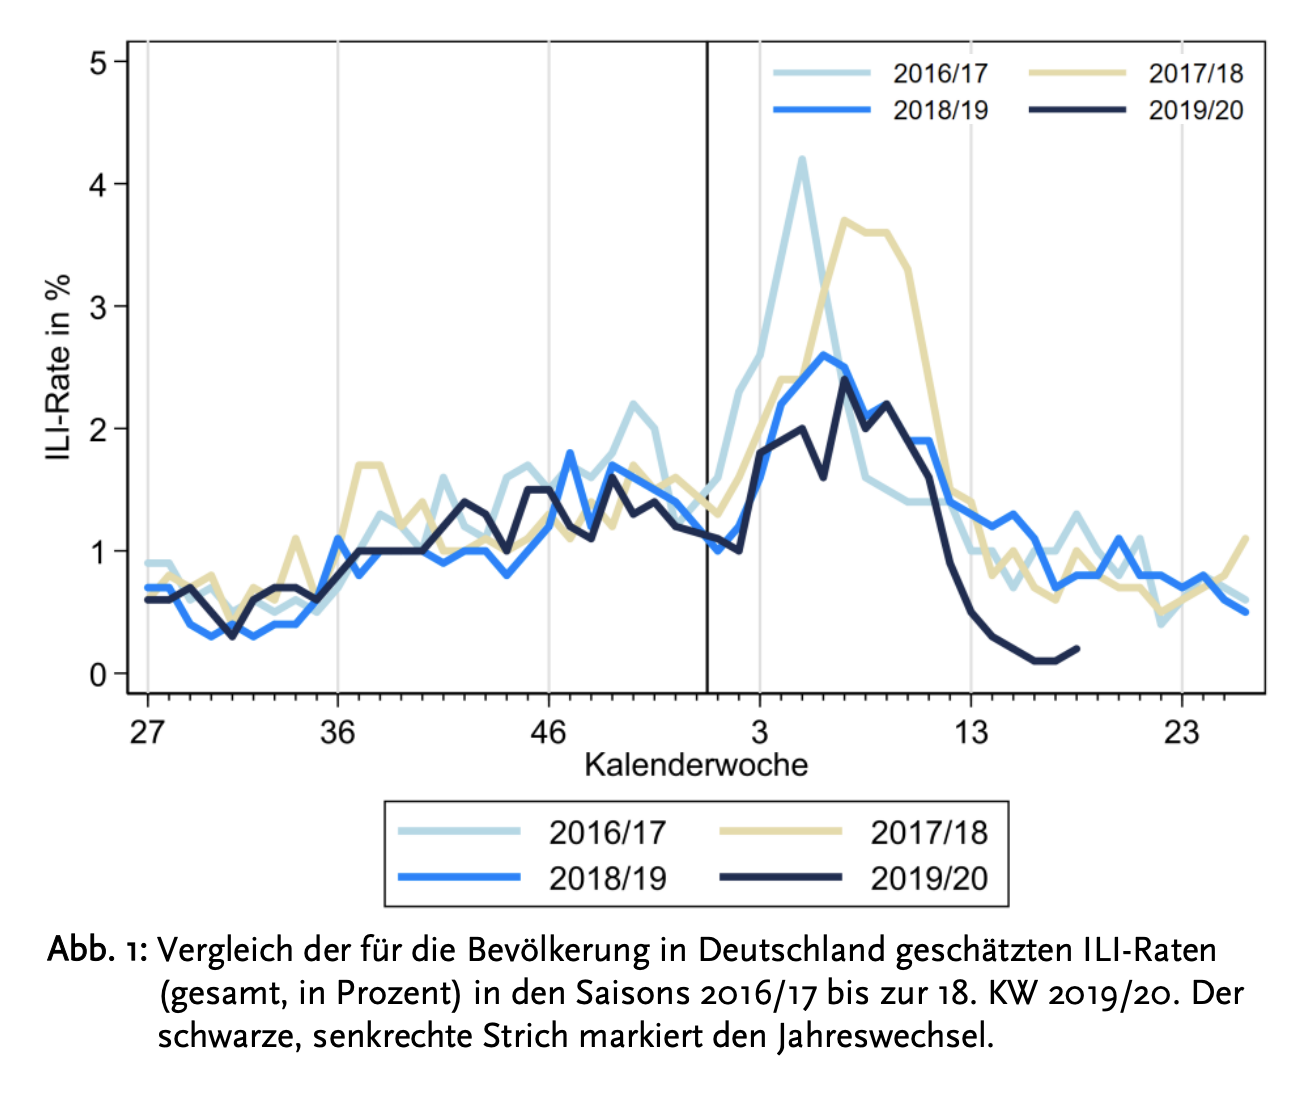
Image source: Robert Koch Institute
Other countries where the death toll has been extremely low include South Korea and Belarus (despite their decision of keeping professional sporting events going).
For time’s sake, I wasn’t able to analyze the situation in every country out there. The fact remains that excess mortality from COVID is an exception throughout the world, and not the norm.
Sweden — No excess mortality
I’ll address the Swedish example in more depth in Fact #5, but so far “It can be assumed that by the end of 2020, Covid19 will not be visible in the Swedish overall mortality.” (SPR)
Switzerland — No excess mortality
As reported by SPR, Cumulative deaths since the beginning of the year in Switzerland remain within the range of a normal flu epidemic and far below the strong flu epidemic of 2015.
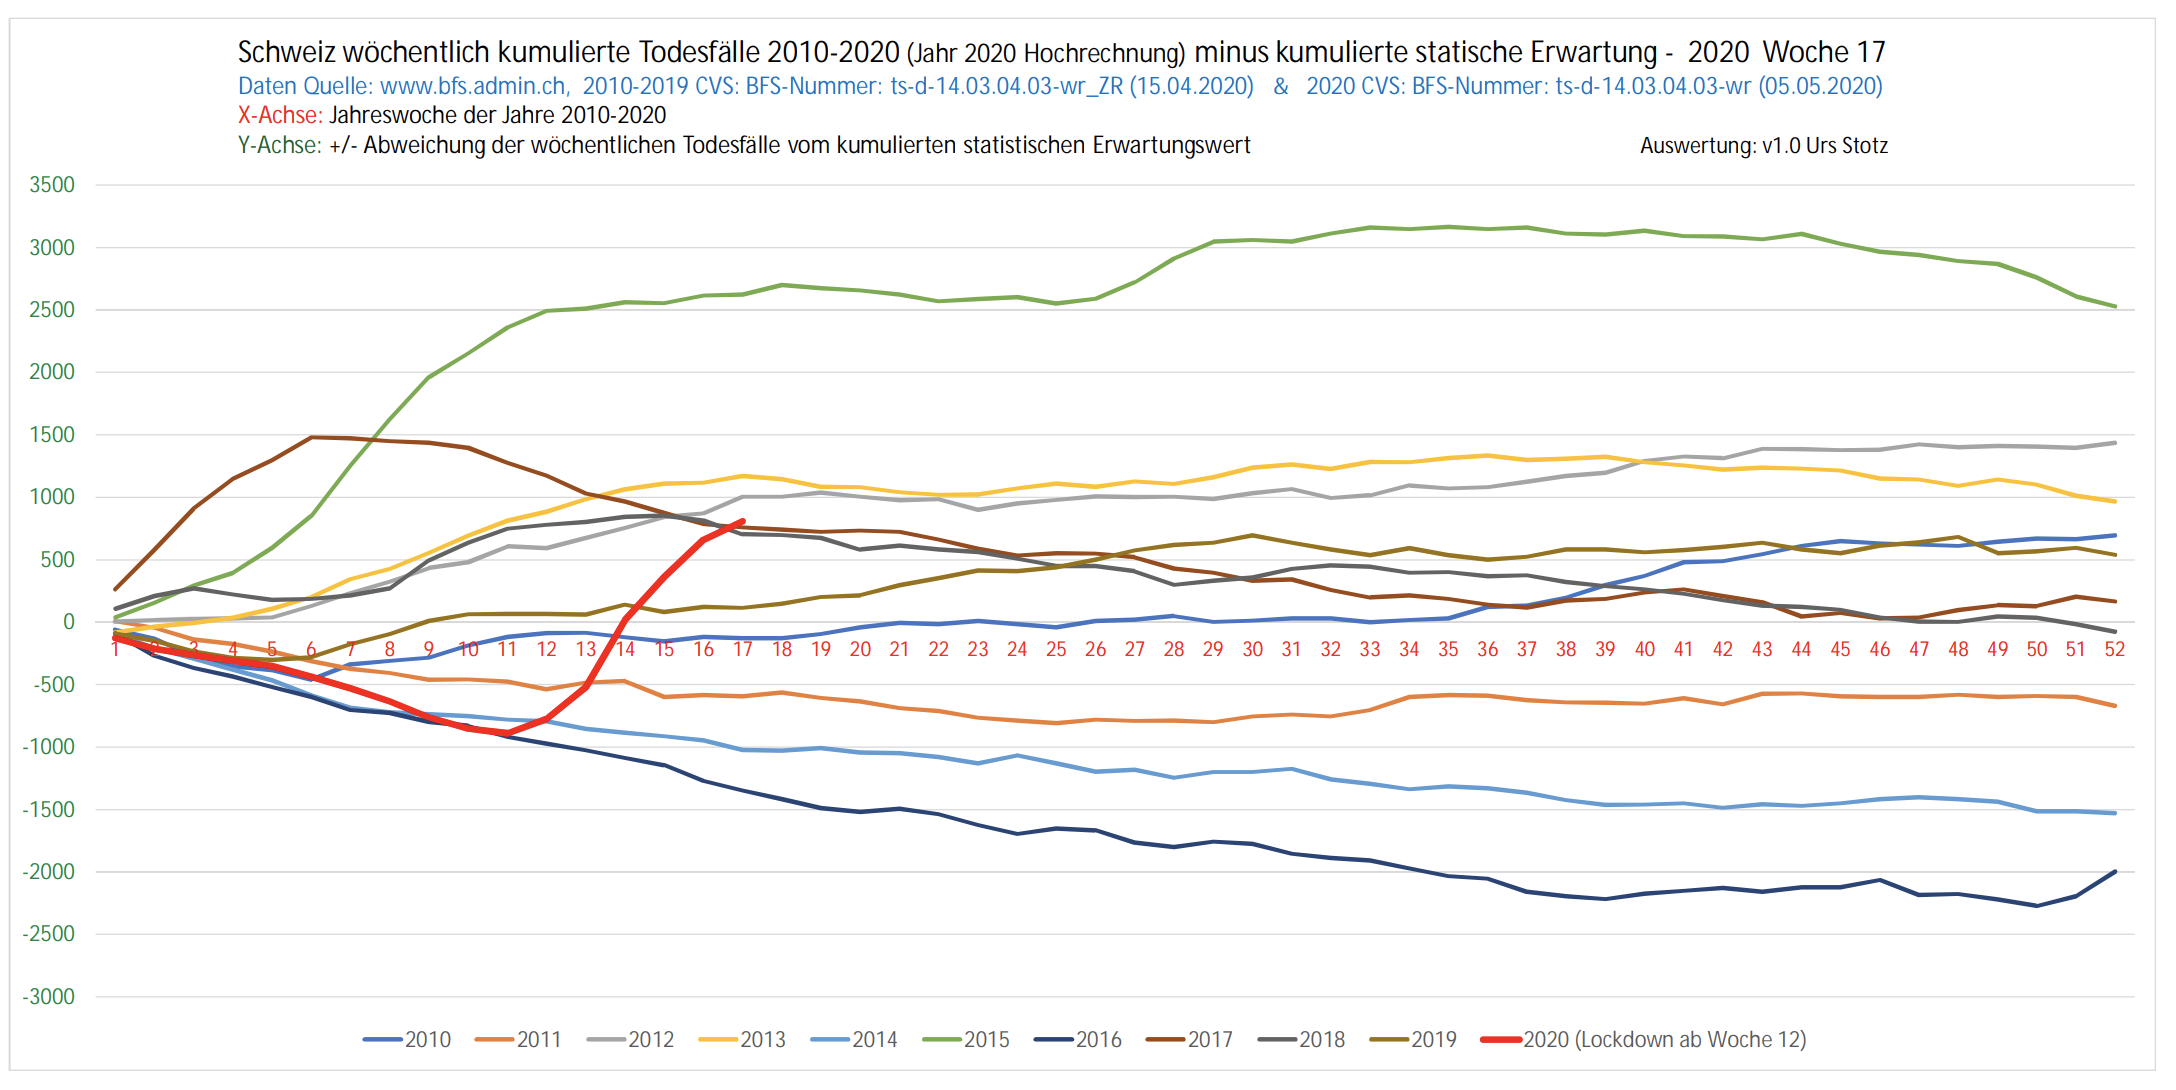
Image source: Swiss Propaganda Research
New York City — Excess deaths, large proportion likely not due to COVID
The COVID pandemic has hit New York City in a dramatic way and caused an important surge in excess mortality — just like it happened in Bergamo (Italy) or some parts of Spain.
What is very unclear at the moment is what proportion of this excess mortality has been caused by COVID, and what proportion has been caused by:
- Overwhelm and panic at some NYC hospitals, which might increase the risk of medical errors, nosocomial (hospital-acquired) infections or prevent COVID or non-COVID patients from getting proper care
- Heart problems that are not caught in time. The number of 911 calls related to heart events in NYC has increased dramatically, and the mortality rate of those who call has also gone up dramatically — which shows many people seek emergency help way too late.
- Delays in other medical interventions or screenings. It’s been reported that these delays are “due to COVID”, but in areas where hospitals are not overwhelmed, it’s fair to argue they are in fact due to our response to COVID.
- Domestic violence, suicides, poor mental health, drug addiction and other known consequences of a rise in unemployment. These will be addressed in Fact #5.
Very recently, another data point reinforced the idea that the lockdown itself is responsible for an important fraction of this death toll.
On May 6th, a study analyzing data from 100 New York hospitals showed that 66% of all new admissions are people who “had been staying at home”.
New York State Governor Cuomo explained:
This is a surprise: Overwhelmingly, the people were at home. […] We thought maybe they were taking public transportation, and we’ve taken special precautions on public transportation, but actually no, because these people were literally at home. [emphasis mine]
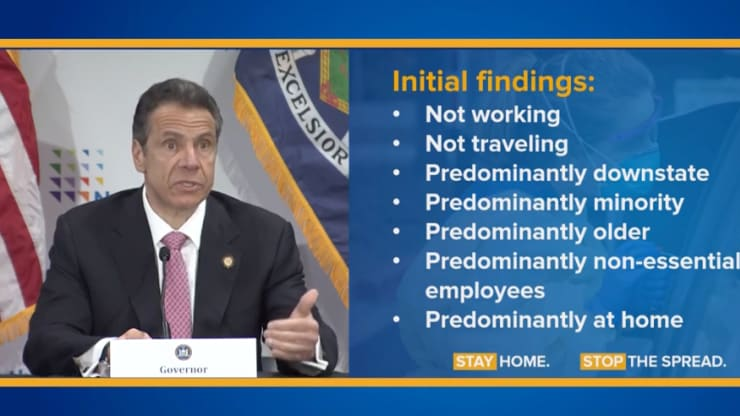
Governor Cuomo details initial findings from the coronavirus pandemic during a press briefing on May 6th, 2020.
Image source: New York State
If these people have been staying at home for weeks, and considering that “84% of the hospitalized cases were people who were not commuting to work through car services, personal cars, public transit or walking”, there’s a strong chance that a large fraction of these hospitalizations are happening because of the side effects of the lockdown — which started more than 8 weeks ago on March 22nd.
In April, a fifth of all excess deaths in NYC had been found to not be related to COVID. Many argue that this is due to undercounting of COVID deaths, but they ignore the very real possibility that lockdown-related consequences are also a factor to consider.
United States (Overall) — Excess deaths, large proportion likely not due to COVID
Overall mortality in the US has spiked, in a similar way to what Europe has experienced. The CDC currently estimates (last consulted May 25th) that out of 84,891-113,139 excess deaths the US has seen since February 1st, 22,105-43,204 — 26 to 38% — are not COVID-related. (thanks for Twitter user @ShaneCoombs for pointing this out).
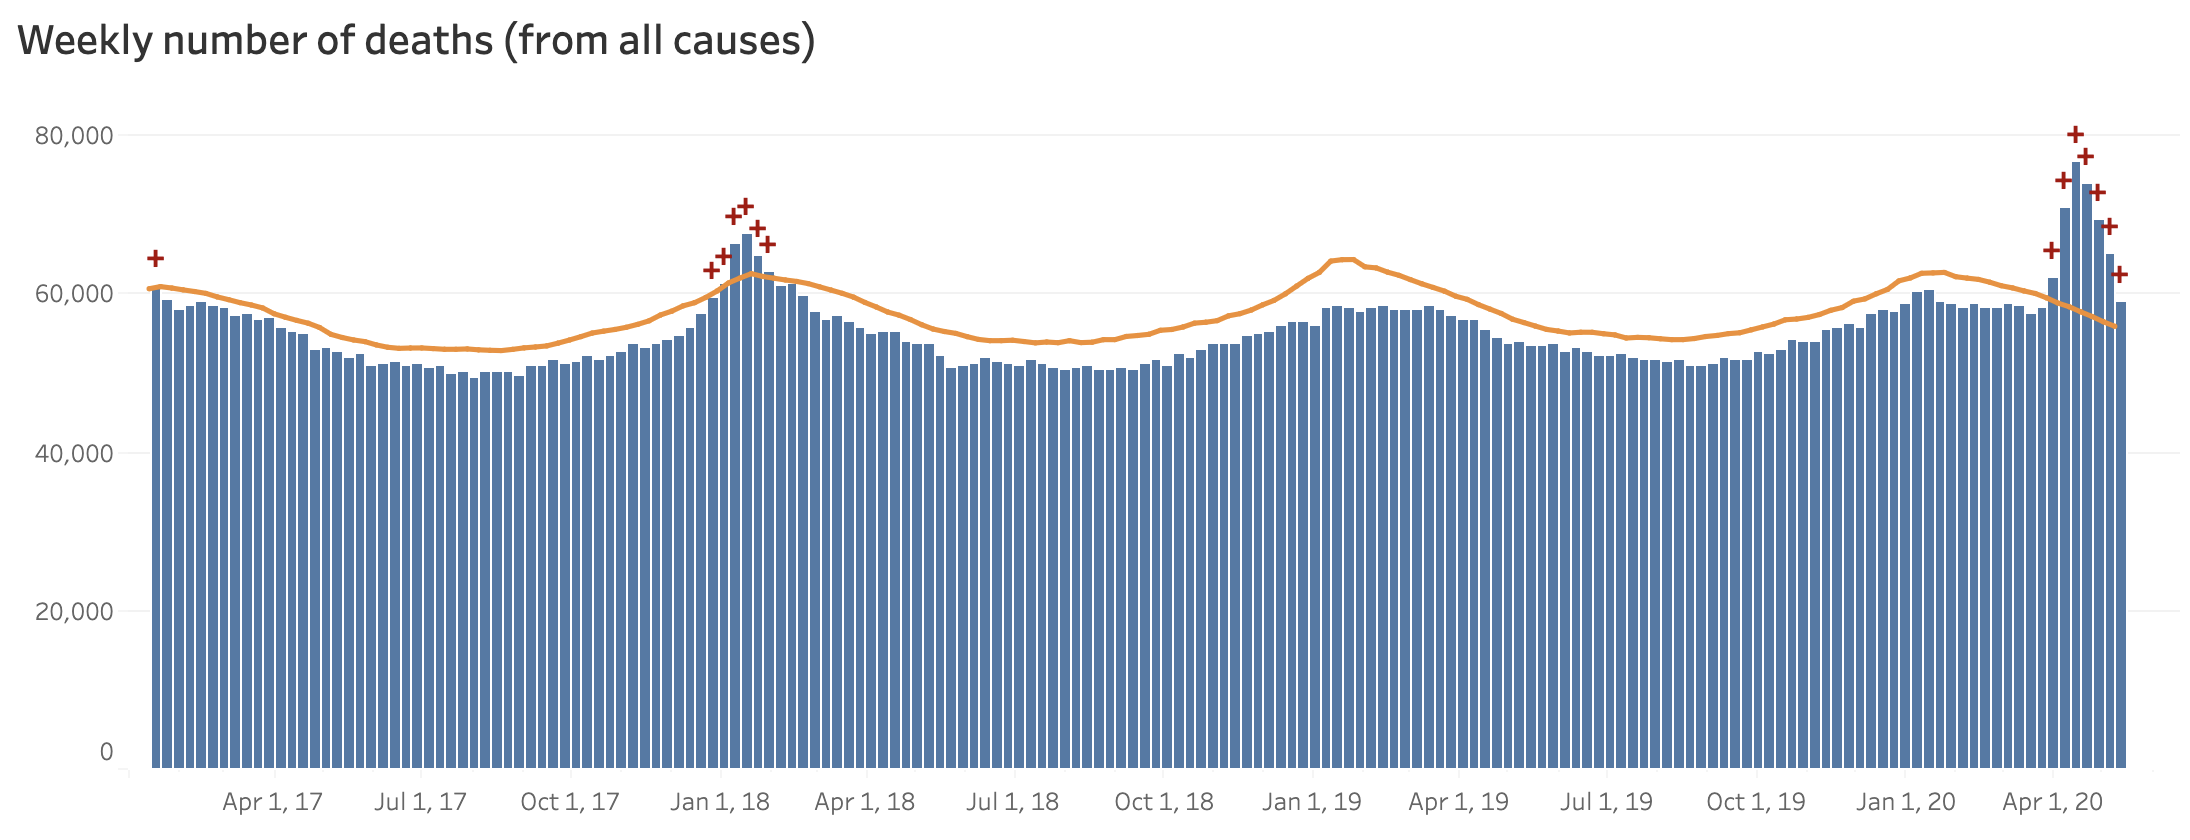
Image source: National Vital Statistics System – Excess Deaths Associated with COVID-19
Not everyone agrees that there are significant excess mortality in the US. Joel Hay PhD, Professor of Pharmaceutical Economics and Policy, maintains that “all-cause excess deaths are continuing well below normal years.” I wasn’t able to get a response from Dr. Hay get an explanation on why he thinks that.
In the State of Oregon, “more Oregonians died the past month than is typical in mid-March and early April, according to data released by state health officials, but fewer than half the excess deaths were officially connected to coronavirus.” [emphasis mine]
Reporter Alex Berenson commented that this data suggests “much of the recent rise in all-cause mortality is lockdown rather than #Covid related – that people may simply be dying at home because they are too frightened to go to hospitals and failing to get medical treatment for other conditions.”
Canada — No excess mortality
Statistics Canada recently revealed that excess mortality has not gone up in Canada during Q1. As reported by CTV News:
The agency found that between Jan. 1 and March 31, the eight provinces and one territory included in the data actually saw 1,145 fewer deaths than expected.
The excess death number was found to be negative in almost every week of the quarter. The only exceptions were one week in late January and the final week of March.
4.4 Death Tolls From COVID Are Relatively Small Compared To The Seasonal Flu And Other Respiratory Infections
One thing that induced massive panic during the COVID crisis is the lack of context displayed in the media when communicating data, and especially the death toll.
“100 died from COVID, and the United States are in shock” — should have, to some extent, been said “100 died from COVID, but consider that the seasonal flu normally kills 30-60k American citizens every single year.” Context matters.
All deaths are tragic. COVID deaths are tragic. Flu deaths are tragic too.
The fact remains that compared to other respiratory infections, COVID is not an especially dangerous or especially deadly virus.
This is why Dr. Didier Raoult — arguably the #1 expert worldwide in Communicable Disease — said this very early in the pandemic:
This is a pretty trivial pandemic. The word might seem shocking since people are dying, and considering the collective hallucinated drama we’re going through.
Still, the data is clear: respiratory infections kill approximately 2,600,000 people worldwide every single year. The same journalistic or political treatment we’ve seen for COVID-19 would cause just as much fear if we applied it to any regular flu season [my translation, source here].
To be fair, Raoult said this when there were only 15,000 COVID deaths worldwide, and at the time of writing there that number has climbed up to 300,000 (alleged) COVID deaths.
Still, Raoult very recently claimed that:
From all respiratory infections it’s probably the easiest to treat. So there is really no reason to get excited anymore. There is really no reason to get excited and rush to produce a vaccine.
We’ll have to wait until the death data is cleaned up until we can make a real assessment of how heavy the death toll from COVID really is.
The reality is that, at the moment, most countries have been facing more deadly flu seasons than COVID seasons.
To put things into context further — since January, this is how many people died from various causes worldwide:
- COVID: 300,000+ alleged deaths
- Influenza: 190,000+
- Pneumonia: 1,250,000+
- Communicable diseases: 4,725,000+
- Smog: 2,916,000+
- Cancer: 3,000,000+
- Malaria: 357,081+ (did you hear about it?)
- Hunger: 4,700,000+
I could argue that we have been paying way too much attention to COVID in the last 6 months compared to the problem it really represents, but the logical comeback would be that we’ve only seen 300k people die from COVID, but prevented millions of additional deaths by imposing global lockdowns.
You know where this is going: Follow me to the next and final part of this article (published on Sunday May 31st) where I’ll address the evidence that shows lockdowns have been marginally effective at best and probably have not saved millions of lives.
Rational Recommendations About COVID DeathsFor concerned citizens:
For decision makers and the media:
|
Read Part 3 Here: Were Lockdowns Even Effective?
=



4 Responses
Thanks, Nick. I’ve been following this story carefully from very many sources and angles, and you’ve done a thorough and accurate study. I wonder if you’ve seen any facts on causes of deaths in US nursing homes? A friend in Seattle who works in a nursing home says that the residents are dying due to loneliness and depression. The volunteers don’t come to entertain them, children and grandchildren don’t visit, and their own usual activities have been stopped. They sit and stare out the window for hours, then many go to sleep and never wake up. The emotional wreckage of this “pandemic” is far worse than the virus.
The vast majority of “confirmed” covid deaths from nursing homes are actually “presumed” deaths. This is true in most countries. In Belgium 95%+ of nursing homes deaths are presumed. I have no doubt that after the fact we’ll revise the covid death toll down by a large margin.
The situation in nursing homes is a mess for a lot of reasons: NYC and the UK sent covid-positive patients to nursing homes, a huge mistake, low vitamin D levels, horrible health status, loneliness, and the staff problems nursing homes had been facing for years now becoming exacerbated by the panic. Some of what we’ve seen happen in some facilities in Quebec breaks my heart.
Another excellent breakdown, Nick. So much work that you’ve put into this. Your articles are really putting everything together in a clear and concise way, and is right in line with the research I’ve read and interviews I’ve seen. Just one small error I wanted to point out: in point 4.3, you mention NYC Mayor Cuomo, however, Andrew Cuomo is New York state’s governor, Bill de Blasio is New York City’s mayor.
Thanks for pointing that out, my bad! Fixed.